Immigrants from Scotland vs Slovak Disability Age 35 to 64
COMPARE
Immigrants from Scotland
Slovak
Disability Age 35 to 64
Disability Age 35 to 64 Comparison
Immigrants from Scotland
Slovaks
10.7%
DISABILITY AGE 35 TO 64
91.3/ 100
METRIC RATING
140th/ 347
METRIC RANK
12.1%
DISABILITY AGE 35 TO 64
2.7/ 100
METRIC RATING
243rd/ 347
METRIC RANK
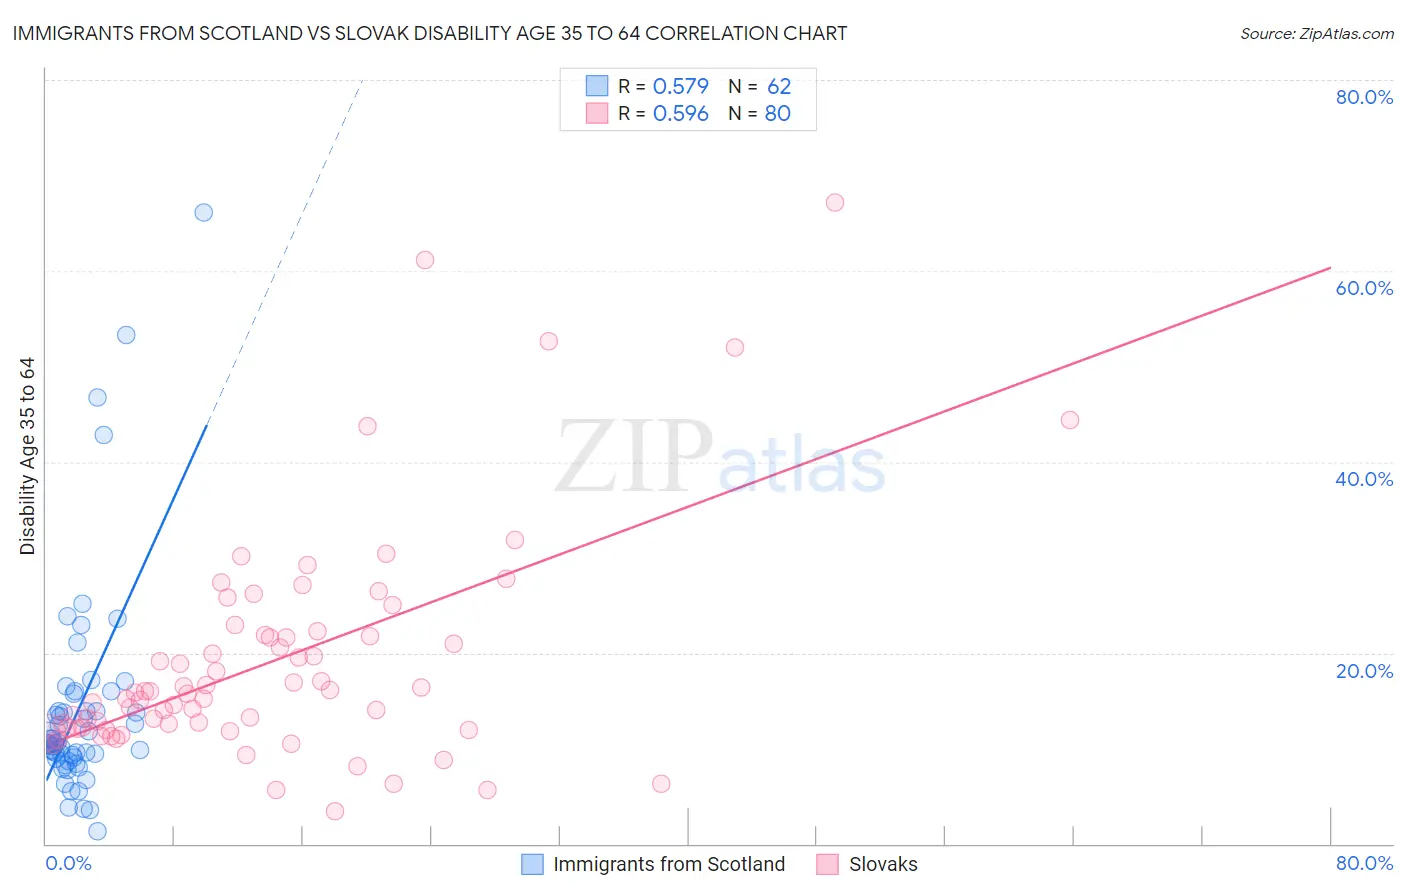
Immigrants from Scotland vs Slovak Disability Age 35 to 64 Correlation Chart
The statistical analysis conducted on geographies consisting of 196,374,606 people shows a substantial positive correlation between the proportion of Immigrants from Scotland and percentage of population with a disability between the ages 34 and 64 in the United States with a correlation coefficient (R) of 0.579 and weighted average of 10.7%. Similarly, the statistical analysis conducted on geographies consisting of 397,624,884 people shows a substantial positive correlation between the proportion of Slovaks and percentage of population with a disability between the ages 34 and 64 in the United States with a correlation coefficient (R) of 0.596 and weighted average of 12.1%, a difference of 12.5%.
Disability Age 35 to 64 Correlation Summary
| Measurement | Immigrants from Scotland | Slovak |
| Minimum | 1.3% | 3.4% |
| Maximum | 66.1% | 67.2% |
| Range | 64.9% | 63.8% |
| Mean | 14.1% | 19.1% |
| Median | 10.5% | 15.8% |
| Interquartile 25% (IQ1) | 9.1% | 12.1% |
| Interquartile 75% (IQ3) | 13.9% | 21.8% |
| Interquartile Range (IQR) | 4.9% | 9.7% |
| Standard Deviation (Sample) | 11.4% | 11.9% |
| Standard Deviation (Population) | 11.3% | 11.8% |
Similar Demographics by Disability Age 35 to 64
Demographics Similar to Immigrants from Scotland by Disability Age 35 to 64
In terms of disability age 35 to 64, the demographic groups most similar to Immigrants from Scotland are Costa Rican (10.7%, a difference of 0.050%), Immigrants from Southern Europe (10.7%, a difference of 0.060%), Immigrants from Costa Rica (10.7%, a difference of 0.12%), Australian (10.8%, a difference of 0.13%), and Immigrants from Saudi Arabia (10.8%, a difference of 0.17%).
| Demographics | Rating | Rank | Disability Age 35 to 64 |
| Immigrants | Immigrants | 92.5 /100 | #133 | Exceptional 10.7% |
| Immigrants | Ecuador | 92.5 /100 | #134 | Exceptional 10.7% |
| Greeks | 92.3 /100 | #135 | Exceptional 10.7% |
| Salvadorans | 91.9 /100 | #136 | Exceptional 10.7% |
| Immigrants | Costa Rica | 91.7 /100 | #137 | Exceptional 10.7% |
| Immigrants | Southern Europe | 91.5 /100 | #138 | Exceptional 10.7% |
| Costa Ricans | 91.4 /100 | #139 | Exceptional 10.7% |
| Immigrants | Scotland | 91.3 /100 | #140 | Exceptional 10.7% |
| Australians | 90.7 /100 | #141 | Exceptional 10.8% |
| Immigrants | Saudi Arabia | 90.6 /100 | #142 | Exceptional 10.8% |
| Sierra Leoneans | 89.7 /100 | #143 | Excellent 10.8% |
| Lithuanians | 88.7 /100 | #144 | Excellent 10.8% |
| Immigrants | Bangladesh | 85.6 /100 | #145 | Excellent 10.9% |
| South American Indians | 83.5 /100 | #146 | Excellent 10.9% |
| Immigrants | Eritrea | 83.4 /100 | #147 | Excellent 10.9% |
Demographics Similar to Slovaks by Disability Age 35 to 64
In terms of disability age 35 to 64, the demographic groups most similar to Slovaks are Samoan (12.1%, a difference of 0.10%), Finnish (12.1%, a difference of 0.26%), Immigrants from Mexico (12.1%, a difference of 0.36%), Mexican American Indian (12.0%, a difference of 0.37%), and Immigrants from Thailand (12.0%, a difference of 0.39%).
| Demographics | Rating | Rank | Disability Age 35 to 64 |
| Immigrants | Middle Africa | 4.5 /100 | #236 | Tragic 12.0% |
| Immigrants | Cambodia | 3.9 /100 | #237 | Tragic 12.0% |
| West Indians | 3.7 /100 | #238 | Tragic 12.0% |
| Immigrants | Western Africa | 3.3 /100 | #239 | Tragic 12.0% |
| Immigrants | Thailand | 3.3 /100 | #240 | Tragic 12.0% |
| Mexican American Indians | 3.2 /100 | #241 | Tragic 12.0% |
| Samoans | 2.8 /100 | #242 | Tragic 12.1% |
| Slovaks | 2.7 /100 | #243 | Tragic 12.1% |
| Finns | 2.3 /100 | #244 | Tragic 12.1% |
| Immigrants | Mexico | 2.2 /100 | #245 | Tragic 12.1% |
| Guamanians/Chamorros | 1.4 /100 | #246 | Tragic 12.2% |
| Immigrants | Senegal | 1.3 /100 | #247 | Tragic 12.2% |
| Spaniards | 1.3 /100 | #248 | Tragic 12.3% |
| Hispanics or Latinos | 1.3 /100 | #249 | Tragic 12.3% |
| Immigrants | Burma/Myanmar | 1.2 /100 | #250 | Tragic 12.3% |