Immigrants from Scotland vs Immigrants from Belize Disability Age 65 to 74
COMPARE
Immigrants from Scotland
Immigrants from Belize
Disability Age 65 to 74
Disability Age 65 to 74 Comparison
Immigrants from Scotland
Immigrants from Belize
21.7%
DISABILITY AGE 65 TO 74
99.3/ 100
METRIC RATING
68th/ 347
METRIC RANK
25.8%
DISABILITY AGE 65 TO 74
0.1/ 100
METRIC RATING
278th/ 347
METRIC RANK
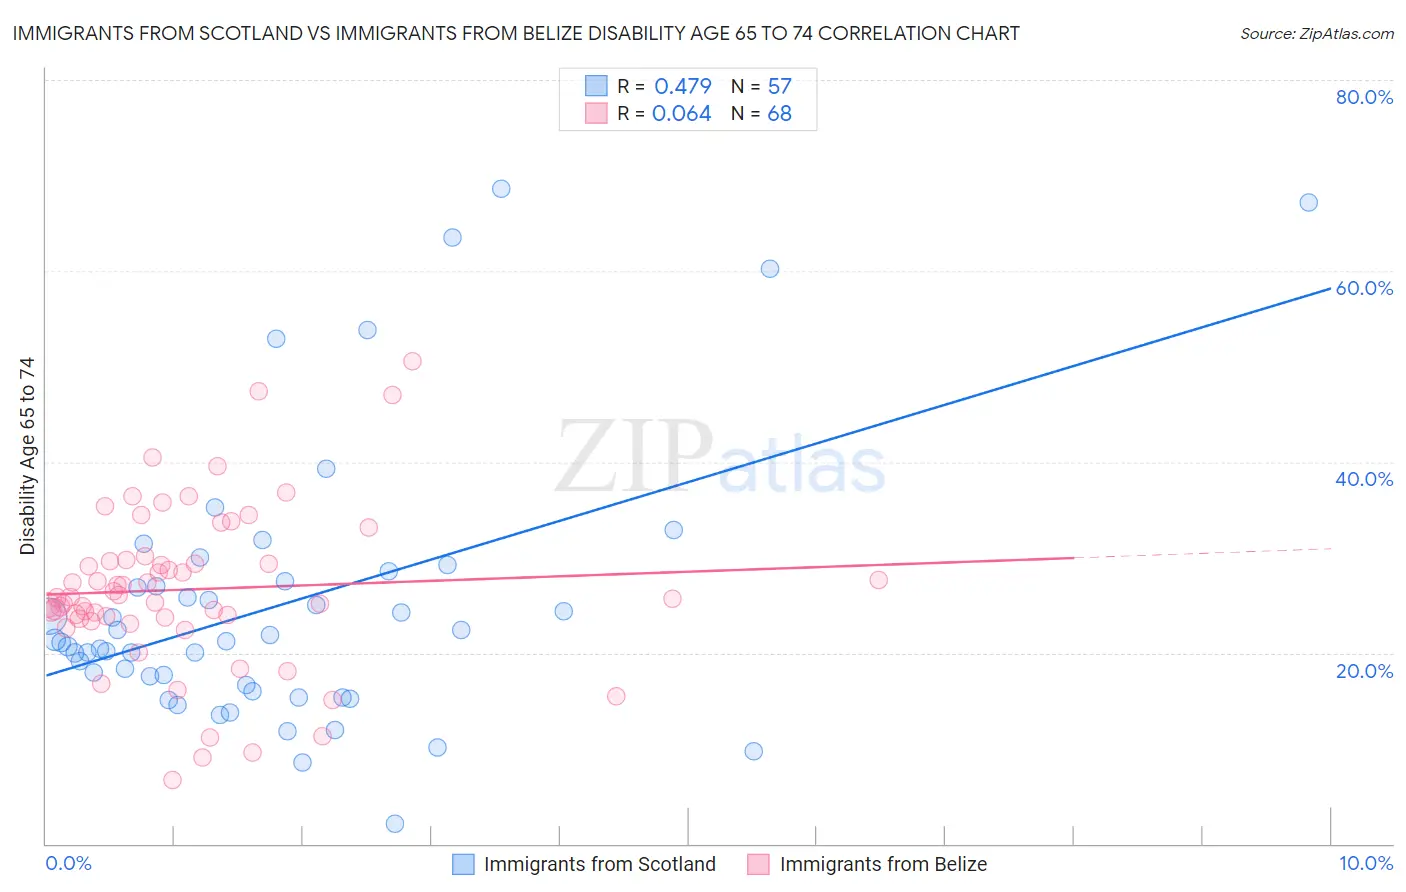
Immigrants from Scotland vs Immigrants from Belize Disability Age 65 to 74 Correlation Chart
The statistical analysis conducted on geographies consisting of 196,345,839 people shows a moderate positive correlation between the proportion of Immigrants from Scotland and percentage of population with a disability between the ages 65 and 75 in the United States with a correlation coefficient (R) of 0.479 and weighted average of 21.7%. Similarly, the statistical analysis conducted on geographies consisting of 130,230,175 people shows a slight positive correlation between the proportion of Immigrants from Belize and percentage of population with a disability between the ages 65 and 75 in the United States with a correlation coefficient (R) of 0.064 and weighted average of 25.8%, a difference of 19.2%.
Disability Age 65 to 74 Correlation Summary
| Measurement | Immigrants from Scotland | Immigrants from Belize |
| Minimum | 2.1% | 6.7% |
| Maximum | 68.7% | 50.6% |
| Range | 66.6% | 43.9% |
| Mean | 25.1% | 26.6% |
| Median | 21.2% | 25.8% |
| Interquartile 25% (IQ1) | 16.3% | 23.6% |
| Interquartile 75% (IQ3) | 28.0% | 29.7% |
| Interquartile Range (IQR) | 11.7% | 6.1% |
| Standard Deviation (Sample) | 14.3% | 8.5% |
| Standard Deviation (Population) | 14.2% | 8.4% |
Similar Demographics by Disability Age 65 to 74
Demographics Similar to Immigrants from Scotland by Disability Age 65 to 74
In terms of disability age 65 to 74, the demographic groups most similar to Immigrants from Scotland are Immigrants from South Africa (21.7%, a difference of 0.090%), Immigrants from Egypt (21.7%, a difference of 0.13%), Chinese (21.7%, a difference of 0.13%), Immigrants from Belarus (21.7%, a difference of 0.19%), and Immigrants from Hungary (21.7%, a difference of 0.20%).
| Demographics | Rating | Rank | Disability Age 65 to 74 |
| Egyptians | 99.5 /100 | #61 | Exceptional 21.6% |
| Carpatho Rusyns | 99.5 /100 | #62 | Exceptional 21.6% |
| Immigrants | Europe | 99.4 /100 | #63 | Exceptional 21.6% |
| Immigrants | Latvia | 99.4 /100 | #64 | Exceptional 21.6% |
| Immigrants | Russia | 99.4 /100 | #65 | Exceptional 21.6% |
| Maltese | 99.4 /100 | #66 | Exceptional 21.6% |
| Immigrants | South Africa | 99.3 /100 | #67 | Exceptional 21.7% |
| Immigrants | Scotland | 99.3 /100 | #68 | Exceptional 21.7% |
| Immigrants | Egypt | 99.2 /100 | #69 | Exceptional 21.7% |
| Chinese | 99.2 /100 | #70 | Exceptional 21.7% |
| Immigrants | Belarus | 99.2 /100 | #71 | Exceptional 21.7% |
| Immigrants | Hungary | 99.2 /100 | #72 | Exceptional 21.7% |
| Immigrants | Venezuela | 99.0 /100 | #73 | Exceptional 21.8% |
| Cambodians | 99.0 /100 | #74 | Exceptional 21.8% |
| Mongolians | 99.0 /100 | #75 | Exceptional 21.8% |
Demographics Similar to Immigrants from Belize by Disability Age 65 to 74
In terms of disability age 65 to 74, the demographic groups most similar to Immigrants from Belize are Belizean (25.8%, a difference of 0.020%), U.S. Virgin Islander (25.9%, a difference of 0.080%), French American Indian (25.8%, a difference of 0.11%), American (25.8%, a difference of 0.13%), and Honduran (25.8%, a difference of 0.13%).
| Demographics | Rating | Rank | Disability Age 65 to 74 |
| Immigrants | Liberia | 0.1 /100 | #271 | Tragic 25.7% |
| Immigrants | Dominica | 0.1 /100 | #272 | Tragic 25.7% |
| Japanese | 0.1 /100 | #273 | Tragic 25.7% |
| Americans | 0.1 /100 | #274 | Tragic 25.8% |
| Hondurans | 0.1 /100 | #275 | Tragic 25.8% |
| French American Indians | 0.1 /100 | #276 | Tragic 25.8% |
| Belizeans | 0.1 /100 | #277 | Tragic 25.8% |
| Immigrants | Belize | 0.1 /100 | #278 | Tragic 25.8% |
| U.S. Virgin Islanders | 0.1 /100 | #279 | Tragic 25.9% |
| Cree | 0.1 /100 | #280 | Tragic 25.9% |
| Immigrants | Honduras | 0.1 /100 | #281 | Tragic 25.9% |
| Delaware | 0.1 /100 | #282 | Tragic 25.9% |
| Spanish Americans | 0.0 /100 | #283 | Tragic 25.9% |
| Immigrants | Azores | 0.0 /100 | #284 | Tragic 26.0% |
| Immigrants | Congo | 0.0 /100 | #285 | Tragic 26.0% |