Immigrants from Scotland vs Houma Female Disability
COMPARE
Immigrants from Scotland
Houma
Female Disability
Female Disability Comparison
Immigrants from Scotland
Houma
12.0%
FEMALE DISABILITY
79.3/ 100
METRIC RATING
152nd/ 347
METRIC RANK
16.9%
FEMALE DISABILITY
0.0/ 100
METRIC RATING
347th/ 347
METRIC RANK
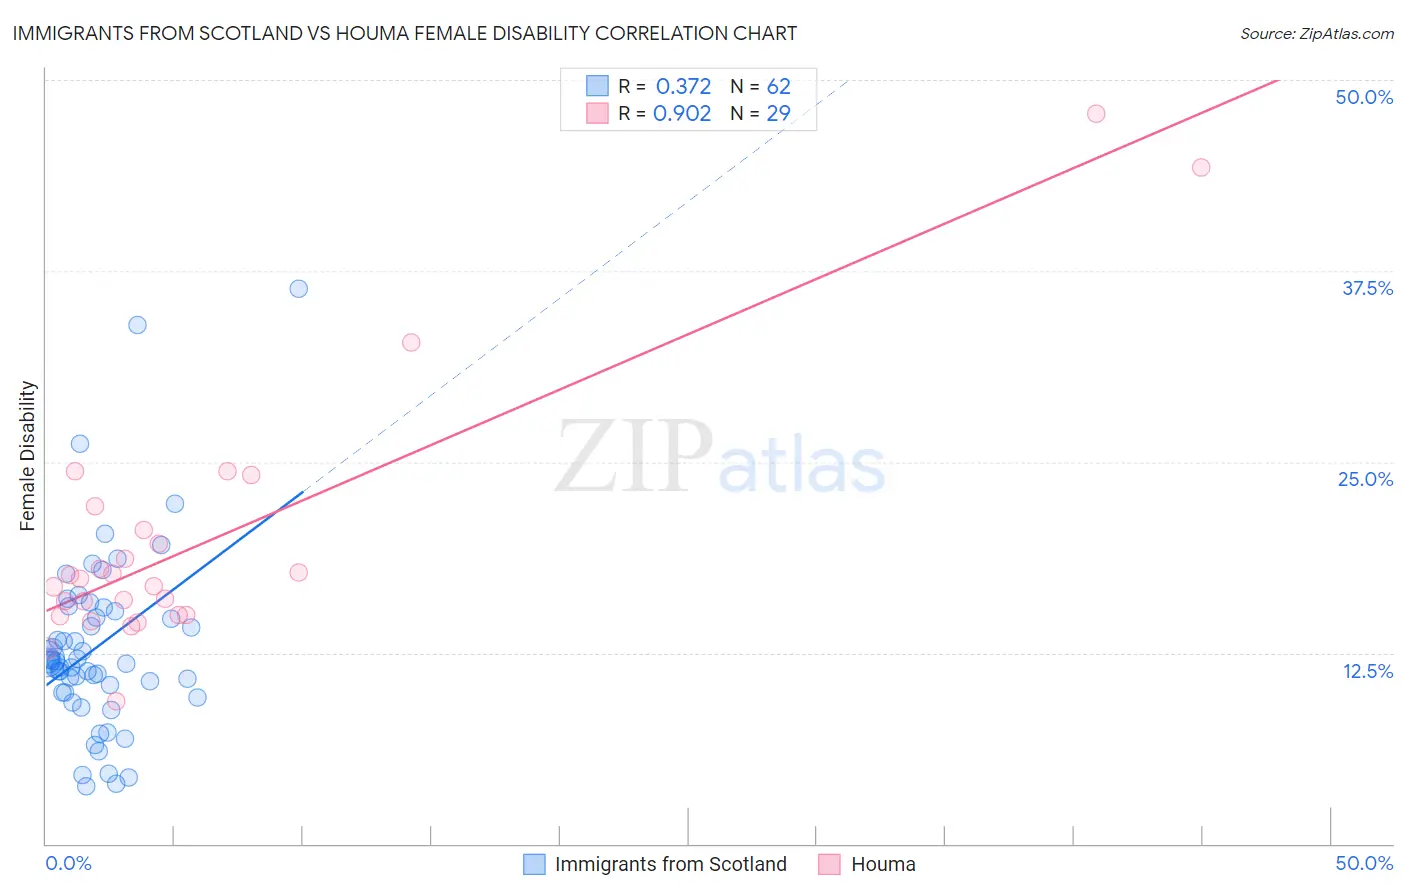
Immigrants from Scotland vs Houma Female Disability Correlation Chart
The statistical analysis conducted on geographies consisting of 196,394,283 people shows a mild positive correlation between the proportion of Immigrants from Scotland and percentage of females with a disability in the United States with a correlation coefficient (R) of 0.372 and weighted average of 12.0%. Similarly, the statistical analysis conducted on geographies consisting of 36,798,615 people shows a near-perfect positive correlation between the proportion of Houma and percentage of females with a disability in the United States with a correlation coefficient (R) of 0.902 and weighted average of 16.9%, a difference of 40.4%.
Female Disability Correlation Summary
| Measurement | Immigrants from Scotland | Houma |
| Minimum | 3.8% | 9.3% |
| Maximum | 36.4% | 47.8% |
| Range | 32.6% | 38.4% |
| Mean | 12.9% | 19.8% |
| Median | 11.9% | 17.3% |
| Interquartile 25% (IQ1) | 9.9% | 14.9% |
| Interquartile 75% (IQ3) | 15.2% | 21.3% |
| Interquartile Range (IQR) | 5.3% | 6.4% |
| Standard Deviation (Sample) | 6.0% | 8.5% |
| Standard Deviation (Population) | 6.0% | 8.4% |
Similar Demographics by Female Disability
Demographics Similar to Immigrants from Scotland by Female Disability
In terms of female disability, the demographic groups most similar to Immigrants from Scotland are Sudanese (12.0%, a difference of 0.010%), Icelander (12.0%, a difference of 0.090%), Immigrants from Moldova (12.0%, a difference of 0.13%), Syrian (12.1%, a difference of 0.13%), and Ghanaian (12.1%, a difference of 0.15%).
| Demographics | Rating | Rank | Female Disability |
| Estonians | 87.8 /100 | #145 | Excellent 12.0% |
| Pakistanis | 84.6 /100 | #146 | Excellent 12.0% |
| Nigerians | 84.0 /100 | #147 | Excellent 12.0% |
| Immigrants | Kenya | 83.1 /100 | #148 | Excellent 12.0% |
| Greeks | 82.0 /100 | #149 | Excellent 12.0% |
| Immigrants | Moldova | 81.4 /100 | #150 | Excellent 12.0% |
| Icelanders | 80.7 /100 | #151 | Excellent 12.0% |
| Immigrants | Scotland | 79.3 /100 | #152 | Good 12.0% |
| Sudanese | 79.1 /100 | #153 | Good 12.0% |
| Syrians | 76.9 /100 | #154 | Good 12.1% |
| Ghanaians | 76.6 /100 | #155 | Good 12.1% |
| Moroccans | 72.9 /100 | #156 | Good 12.1% |
| Danes | 72.5 /100 | #157 | Good 12.1% |
| Immigrants | Middle Africa | 72.4 /100 | #158 | Good 12.1% |
| Immigrants | Central America | 67.7 /100 | #159 | Good 12.1% |
Demographics Similar to Houma by Female Disability
In terms of female disability, the demographic groups most similar to Houma are Tsimshian (16.8%, a difference of 0.77%), Puerto Rican (16.6%, a difference of 1.7%), Kiowa (15.8%, a difference of 7.0%), Lumbee (15.8%, a difference of 7.1%), and Creek (15.7%, a difference of 7.9%).
| Demographics | Rating | Rank | Female Disability |
| Immigrants | Azores | 0.0 /100 | #333 | Tragic 14.9% |
| Cherokee | 0.0 /100 | #334 | Tragic 14.9% |
| Cajuns | 0.0 /100 | #335 | Tragic 14.9% |
| Seminole | 0.0 /100 | #336 | Tragic 15.0% |
| Tohono O'odham | 0.0 /100 | #337 | Tragic 15.0% |
| Dutch West Indians | 0.0 /100 | #338 | Tragic 15.0% |
| Colville | 0.0 /100 | #339 | Tragic 15.1% |
| Chickasaw | 0.0 /100 | #340 | Tragic 15.2% |
| Choctaw | 0.0 /100 | #341 | Tragic 15.4% |
| Creek | 0.0 /100 | #342 | Tragic 15.7% |
| Lumbee | 0.0 /100 | #343 | Tragic 15.8% |
| Kiowa | 0.0 /100 | #344 | Tragic 15.8% |
| Puerto Ricans | 0.0 /100 | #345 | Tragic 16.6% |
| Tsimshian | 0.0 /100 | #346 | Tragic 16.8% |
| Houma | 0.0 /100 | #347 | Tragic 16.9% |