Vietnamese vs Houma Female Disability
COMPARE
Vietnamese
Houma
Female Disability
Female Disability Comparison
Vietnamese
Houma
11.6%
FEMALE DISABILITY
99.5/ 100
METRIC RATING
89th/ 347
METRIC RANK
16.9%
FEMALE DISABILITY
0.0/ 100
METRIC RATING
347th/ 347
METRIC RANK
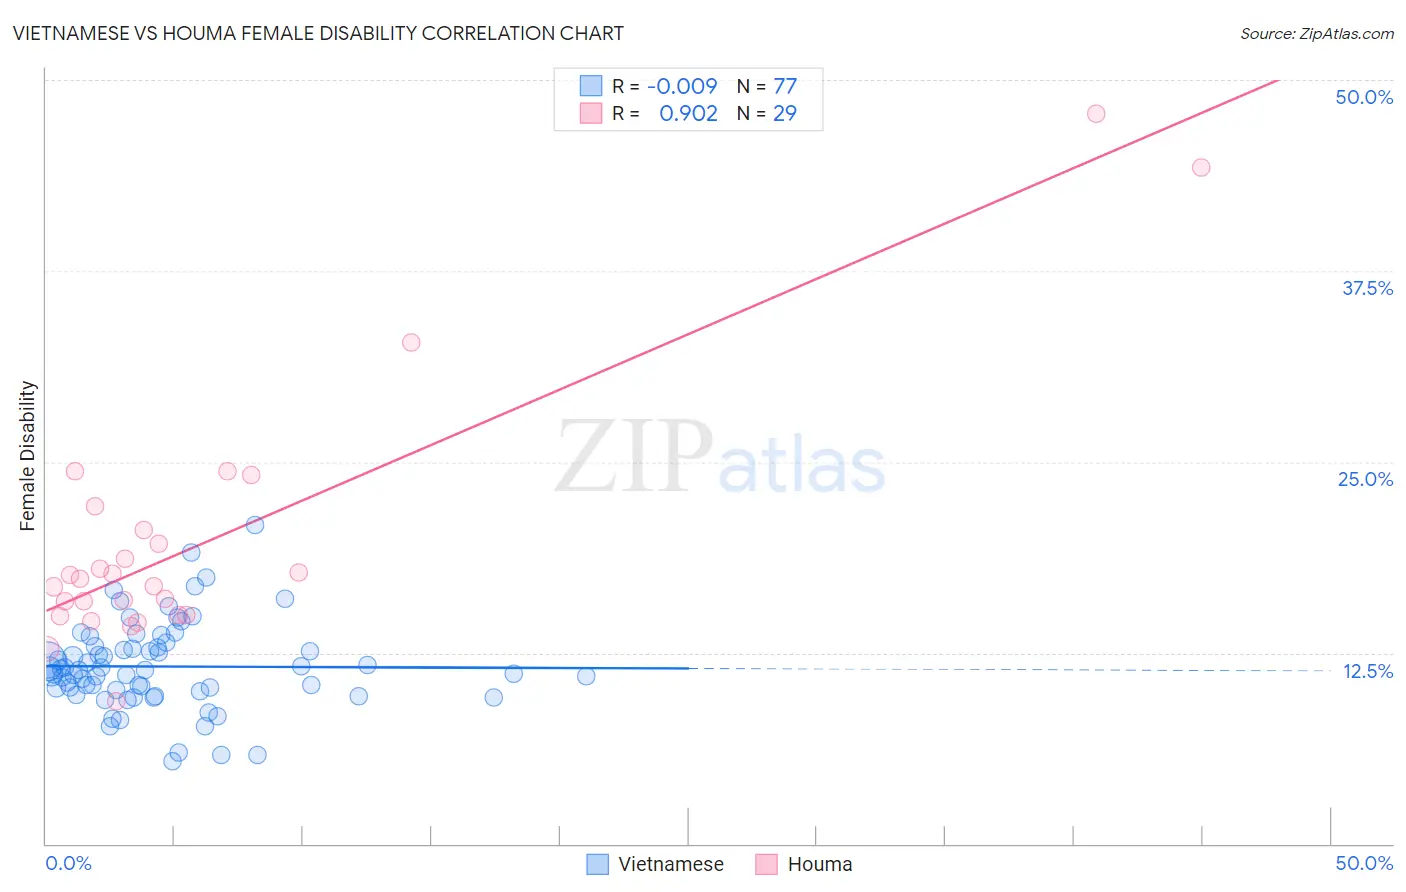
Vietnamese vs Houma Female Disability Correlation Chart
The statistical analysis conducted on geographies consisting of 170,755,958 people shows no correlation between the proportion of Vietnamese and percentage of females with a disability in the United States with a correlation coefficient (R) of -0.009 and weighted average of 11.6%. Similarly, the statistical analysis conducted on geographies consisting of 36,798,615 people shows a near-perfect positive correlation between the proportion of Houma and percentage of females with a disability in the United States with a correlation coefficient (R) of 0.902 and weighted average of 16.9%, a difference of 45.8%.
Female Disability Correlation Summary
| Measurement | Vietnamese | Houma |
| Minimum | 5.4% | 9.3% |
| Maximum | 20.8% | 47.8% |
| Range | 15.5% | 38.4% |
| Mean | 11.6% | 19.8% |
| Median | 11.3% | 17.3% |
| Interquartile 25% (IQ1) | 10.0% | 14.9% |
| Interquartile 75% (IQ3) | 12.9% | 21.3% |
| Interquartile Range (IQR) | 2.9% | 6.4% |
| Standard Deviation (Sample) | 2.9% | 8.5% |
| Standard Deviation (Population) | 2.8% | 8.4% |
Similar Demographics by Female Disability
Demographics Similar to Vietnamese by Female Disability
In terms of female disability, the demographic groups most similar to Vietnamese are Immigrants from Romania (11.6%, a difference of 0.010%), Immigrants from Zimbabwe (11.6%, a difference of 0.010%), Immigrants from Czechoslovakia (11.6%, a difference of 0.020%), Immigrants from Denmark (11.6%, a difference of 0.10%), and Yup'ik (11.6%, a difference of 0.10%).
| Demographics | Rating | Rank | Female Disability |
| Luxembourgers | 99.6 /100 | #82 | Exceptional 11.6% |
| Immigrants | Serbia | 99.6 /100 | #83 | Exceptional 11.6% |
| Immigrants | Poland | 99.6 /100 | #84 | Exceptional 11.6% |
| Palestinians | 99.6 /100 | #85 | Exceptional 11.6% |
| Immigrants | Cameroon | 99.6 /100 | #86 | Exceptional 11.6% |
| Immigrants | Denmark | 99.5 /100 | #87 | Exceptional 11.6% |
| Yup'ik | 99.5 /100 | #88 | Exceptional 11.6% |
| Vietnamese | 99.5 /100 | #89 | Exceptional 11.6% |
| Immigrants | Romania | 99.5 /100 | #90 | Exceptional 11.6% |
| Immigrants | Zimbabwe | 99.5 /100 | #91 | Exceptional 11.6% |
| Immigrants | Czechoslovakia | 99.5 /100 | #92 | Exceptional 11.6% |
| Immigrants | Sierra Leone | 99.4 /100 | #93 | Exceptional 11.6% |
| Immigrants | Brazil | 99.4 /100 | #94 | Exceptional 11.6% |
| Immigrants | Northern Europe | 99.4 /100 | #95 | Exceptional 11.6% |
| Immigrants | Russia | 99.0 /100 | #96 | Exceptional 11.7% |
Demographics Similar to Houma by Female Disability
In terms of female disability, the demographic groups most similar to Houma are Tsimshian (16.8%, a difference of 0.77%), Puerto Rican (16.6%, a difference of 1.7%), Kiowa (15.8%, a difference of 7.0%), Lumbee (15.8%, a difference of 7.1%), and Creek (15.7%, a difference of 7.9%).
| Demographics | Rating | Rank | Female Disability |
| Immigrants | Azores | 0.0 /100 | #333 | Tragic 14.9% |
| Cherokee | 0.0 /100 | #334 | Tragic 14.9% |
| Cajuns | 0.0 /100 | #335 | Tragic 14.9% |
| Seminole | 0.0 /100 | #336 | Tragic 15.0% |
| Tohono O'odham | 0.0 /100 | #337 | Tragic 15.0% |
| Dutch West Indians | 0.0 /100 | #338 | Tragic 15.0% |
| Colville | 0.0 /100 | #339 | Tragic 15.1% |
| Chickasaw | 0.0 /100 | #340 | Tragic 15.2% |
| Choctaw | 0.0 /100 | #341 | Tragic 15.4% |
| Creek | 0.0 /100 | #342 | Tragic 15.7% |
| Lumbee | 0.0 /100 | #343 | Tragic 15.8% |
| Kiowa | 0.0 /100 | #344 | Tragic 15.8% |
| Puerto Ricans | 0.0 /100 | #345 | Tragic 16.6% |
| Tsimshian | 0.0 /100 | #346 | Tragic 16.8% |
| Houma | 0.0 /100 | #347 | Tragic 16.9% |