Dominican vs Houma Female Disability
COMPARE
Dominican
Houma
Female Disability
Female Disability Comparison
Dominicans
Houma
13.5%
FEMALE DISABILITY
0.0/ 100
METRIC RATING
305th/ 347
METRIC RANK
16.9%
FEMALE DISABILITY
0.0/ 100
METRIC RATING
347th/ 347
METRIC RANK
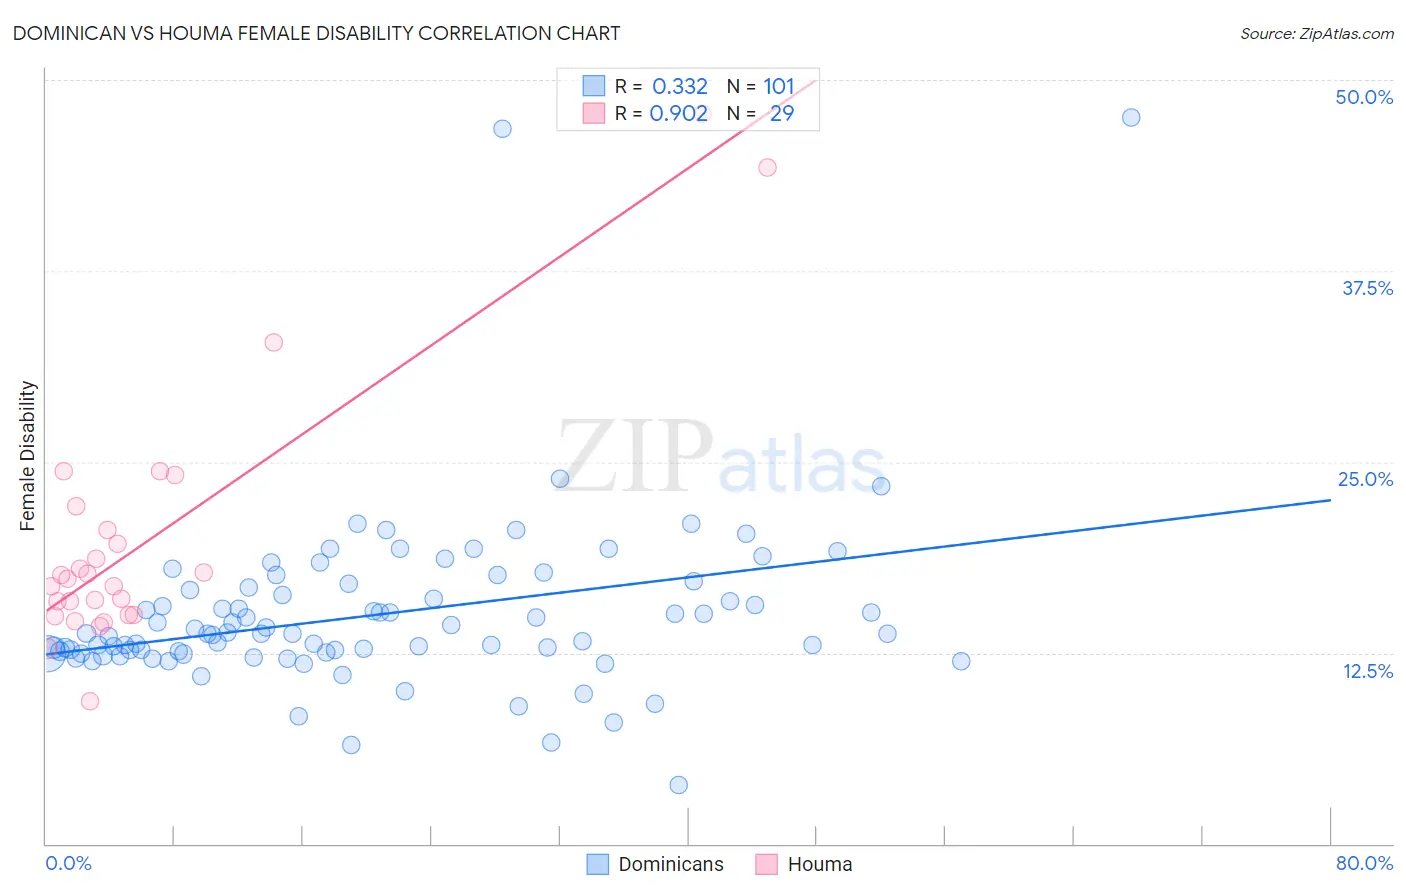
Dominican vs Houma Female Disability Correlation Chart
The statistical analysis conducted on geographies consisting of 355,036,976 people shows a mild positive correlation between the proportion of Dominicans and percentage of females with a disability in the United States with a correlation coefficient (R) of 0.332 and weighted average of 13.5%. Similarly, the statistical analysis conducted on geographies consisting of 36,798,615 people shows a near-perfect positive correlation between the proportion of Houma and percentage of females with a disability in the United States with a correlation coefficient (R) of 0.902 and weighted average of 16.9%, a difference of 25.2%.
Female Disability Correlation Summary
| Measurement | Dominican | Houma |
| Minimum | 3.9% | 9.3% |
| Maximum | 47.5% | 47.8% |
| Range | 43.7% | 38.4% |
| Mean | 15.0% | 19.8% |
| Median | 13.8% | 17.3% |
| Interquartile 25% (IQ1) | 12.5% | 14.9% |
| Interquartile 75% (IQ3) | 16.7% | 21.3% |
| Interquartile Range (IQR) | 4.2% | 6.4% |
| Standard Deviation (Sample) | 5.8% | 8.5% |
| Standard Deviation (Population) | 5.7% | 8.4% |
Similar Demographics by Female Disability
Demographics Similar to Dominicans by Female Disability
In terms of female disability, the demographic groups most similar to Dominicans are Immigrants from Micronesia (13.5%, a difference of 0.31%), Immigrants from Portugal (13.5%, a difference of 0.34%), Scotch-Irish (13.4%, a difference of 0.35%), African (13.4%, a difference of 0.48%), and French Canadian (13.6%, a difference of 0.63%).
| Demographics | Rating | Rank | Female Disability |
| Immigrants | Nonimmigrants | 0.0 /100 | #298 | Tragic 13.4% |
| Immigrants | Dominican Republic | 0.0 /100 | #299 | Tragic 13.4% |
| Pennsylvania Germans | 0.0 /100 | #300 | Tragic 13.4% |
| Africans | 0.0 /100 | #301 | Tragic 13.4% |
| Scotch-Irish | 0.0 /100 | #302 | Tragic 13.4% |
| Immigrants | Portugal | 0.0 /100 | #303 | Tragic 13.5% |
| Immigrants | Micronesia | 0.0 /100 | #304 | Tragic 13.5% |
| Dominicans | 0.0 /100 | #305 | Tragic 13.5% |
| French Canadians | 0.0 /100 | #306 | Tragic 13.6% |
| Central American Indians | 0.0 /100 | #307 | Tragic 13.6% |
| Cree | 0.0 /100 | #308 | Tragic 13.7% |
| French American Indians | 0.0 /100 | #309 | Tragic 13.7% |
| Apache | 0.0 /100 | #310 | Tragic 13.7% |
| Hopi | 0.0 /100 | #311 | Tragic 13.7% |
| Delaware | 0.0 /100 | #312 | Tragic 13.8% |
Demographics Similar to Houma by Female Disability
In terms of female disability, the demographic groups most similar to Houma are Tsimshian (16.8%, a difference of 0.77%), Puerto Rican (16.6%, a difference of 1.7%), Kiowa (15.8%, a difference of 7.0%), Lumbee (15.8%, a difference of 7.1%), and Creek (15.7%, a difference of 7.9%).
| Demographics | Rating | Rank | Female Disability |
| Immigrants | Azores | 0.0 /100 | #333 | Tragic 14.9% |
| Cherokee | 0.0 /100 | #334 | Tragic 14.9% |
| Cajuns | 0.0 /100 | #335 | Tragic 14.9% |
| Seminole | 0.0 /100 | #336 | Tragic 15.0% |
| Tohono O'odham | 0.0 /100 | #337 | Tragic 15.0% |
| Dutch West Indians | 0.0 /100 | #338 | Tragic 15.0% |
| Colville | 0.0 /100 | #339 | Tragic 15.1% |
| Chickasaw | 0.0 /100 | #340 | Tragic 15.2% |
| Choctaw | 0.0 /100 | #341 | Tragic 15.4% |
| Creek | 0.0 /100 | #342 | Tragic 15.7% |
| Lumbee | 0.0 /100 | #343 | Tragic 15.8% |
| Kiowa | 0.0 /100 | #344 | Tragic 15.8% |
| Puerto Ricans | 0.0 /100 | #345 | Tragic 16.6% |
| Tsimshian | 0.0 /100 | #346 | Tragic 16.8% |
| Houma | 0.0 /100 | #347 | Tragic 16.9% |