Immigrants from Saudi Arabia vs Immigrants from Cameroon Cognitive Disability
COMPARE
Immigrants from Saudi Arabia
Immigrants from Cameroon
Cognitive Disability
Cognitive Disability Comparison
Immigrants from Saudi Arabia
Immigrants from Cameroon
19.1%
COGNITIVE DISABILITY
0.0/ 100
METRIC RATING
337th/ 347
METRIC RANK
17.6%
COGNITIVE DISABILITY
9.3/ 100
METRIC RATING
208th/ 347
METRIC RANK
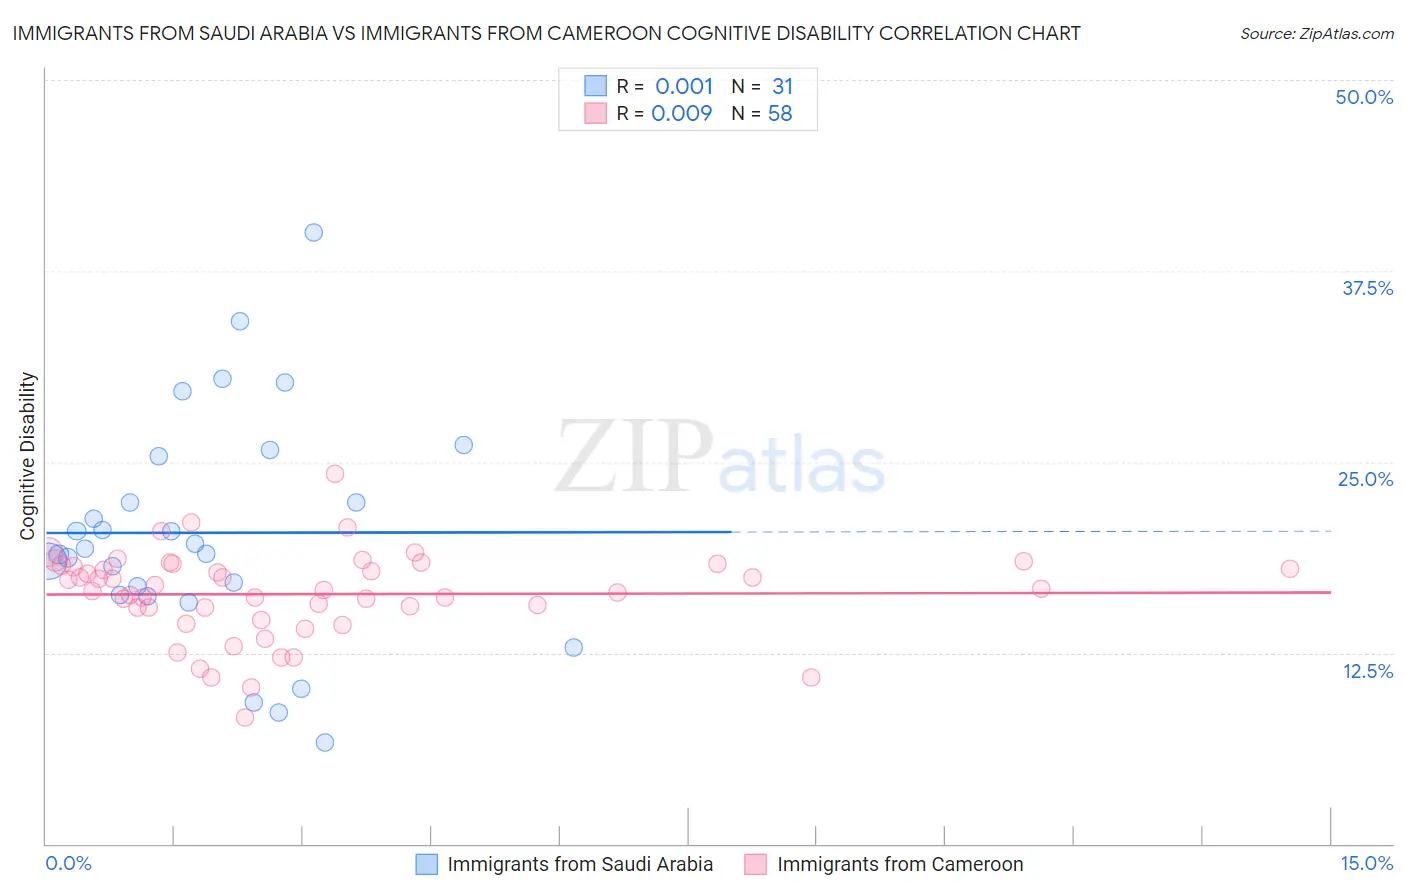
Immigrants from Saudi Arabia vs Immigrants from Cameroon Cognitive Disability Correlation Chart
The statistical analysis conducted on geographies consisting of 164,285,964 people shows no correlation between the proportion of Immigrants from Saudi Arabia and percentage of population with cognitive disability in the United States with a correlation coefficient (R) of 0.001 and weighted average of 19.1%. Similarly, the statistical analysis conducted on geographies consisting of 130,751,694 people shows no correlation between the proportion of Immigrants from Cameroon and percentage of population with cognitive disability in the United States with a correlation coefficient (R) of 0.009 and weighted average of 17.6%, a difference of 8.5%.
Cognitive Disability Correlation Summary
| Measurement | Immigrants from Saudi Arabia | Immigrants from Cameroon |
| Minimum | 6.6% | 8.3% |
| Maximum | 40.0% | 24.2% |
| Range | 33.4% | 15.9% |
| Mean | 20.4% | 16.3% |
| Median | 19.3% | 16.7% |
| Interquartile 25% (IQ1) | 16.3% | 15.5% |
| Interquartile 75% (IQ3) | 25.4% | 18.3% |
| Interquartile Range (IQR) | 9.1% | 2.8% |
| Standard Deviation (Sample) | 7.4% | 2.9% |
| Standard Deviation (Population) | 7.3% | 2.9% |
Similar Demographics by Cognitive Disability
Demographics Similar to Immigrants from Saudi Arabia by Cognitive Disability
In terms of cognitive disability, the demographic groups most similar to Immigrants from Saudi Arabia are Black/African American (19.0%, a difference of 0.13%), Lumbee (19.1%, a difference of 0.34%), Senegalese (19.0%, a difference of 0.42%), Puerto Rican (19.2%, a difference of 0.82%), and Cape Verdean (19.2%, a difference of 0.84%).
| Demographics | Rating | Rank | Cognitive Disability |
| Immigrants | Dominican Republic | 0.0 /100 | #330 | Tragic 18.8% |
| Pima | 0.0 /100 | #331 | Tragic 18.8% |
| Immigrants | Sudan | 0.0 /100 | #332 | Tragic 18.8% |
| Immigrants | Yemen | 0.0 /100 | #333 | Tragic 18.8% |
| Sudanese | 0.0 /100 | #334 | Tragic 18.9% |
| Senegalese | 0.0 /100 | #335 | Tragic 19.0% |
| Blacks/African Americans | 0.0 /100 | #336 | Tragic 19.0% |
| Immigrants | Saudi Arabia | 0.0 /100 | #337 | Tragic 19.1% |
| Lumbee | 0.0 /100 | #338 | Tragic 19.1% |
| Puerto Ricans | 0.0 /100 | #339 | Tragic 19.2% |
| Cape Verdeans | 0.0 /100 | #340 | Tragic 19.2% |
| Tohono O'odham | 0.0 /100 | #341 | Tragic 19.3% |
| Houma | 0.0 /100 | #342 | Tragic 19.3% |
| Immigrants | Zaire | 0.0 /100 | #343 | Tragic 19.4% |
| Immigrants | Congo | 0.0 /100 | #344 | Tragic 19.7% |
Demographics Similar to Immigrants from Cameroon by Cognitive Disability
In terms of cognitive disability, the demographic groups most similar to Immigrants from Cameroon are Immigrants from Latin America (17.6%, a difference of 0.030%), Immigrants from Trinidad and Tobago (17.6%, a difference of 0.050%), Immigrants from Jamaica (17.6%, a difference of 0.070%), Alaska Native (17.5%, a difference of 0.090%), and Puget Sound Salish (17.5%, a difference of 0.12%).
| Demographics | Rating | Rank | Cognitive Disability |
| South American Indians | 13.0 /100 | #201 | Poor 17.5% |
| Immigrants | Morocco | 12.0 /100 | #202 | Poor 17.5% |
| Immigrants | Caribbean | 11.0 /100 | #203 | Poor 17.5% |
| Immigrants | Zimbabwe | 11.0 /100 | #204 | Poor 17.5% |
| Puget Sound Salish | 10.9 /100 | #205 | Poor 17.5% |
| Alaska Natives | 10.4 /100 | #206 | Poor 17.5% |
| Immigrants | Latin America | 9.7 /100 | #207 | Tragic 17.6% |
| Immigrants | Cameroon | 9.3 /100 | #208 | Tragic 17.6% |
| Immigrants | Trinidad and Tobago | 8.7 /100 | #209 | Tragic 17.6% |
| Immigrants | Jamaica | 8.5 /100 | #210 | Tragic 17.6% |
| Taiwanese | 7.7 /100 | #211 | Tragic 17.6% |
| Immigrants | Oceania | 7.3 /100 | #212 | Tragic 17.6% |
| Hawaiians | 7.2 /100 | #213 | Tragic 17.6% |
| Immigrants | El Salvador | 7.0 /100 | #214 | Tragic 17.6% |
| Alaskan Athabascans | 6.9 /100 | #215 | Tragic 17.6% |