Immigrants from Saudi Arabia vs Apache Cognitive Disability
COMPARE
Immigrants from Saudi Arabia
Apache
Cognitive Disability
Cognitive Disability Comparison
Immigrants from Saudi Arabia
Apache
19.1%
COGNITIVE DISABILITY
0.0/ 100
METRIC RATING
337th/ 347
METRIC RANK
18.6%
COGNITIVE DISABILITY
0.0/ 100
METRIC RATING
320th/ 347
METRIC RANK
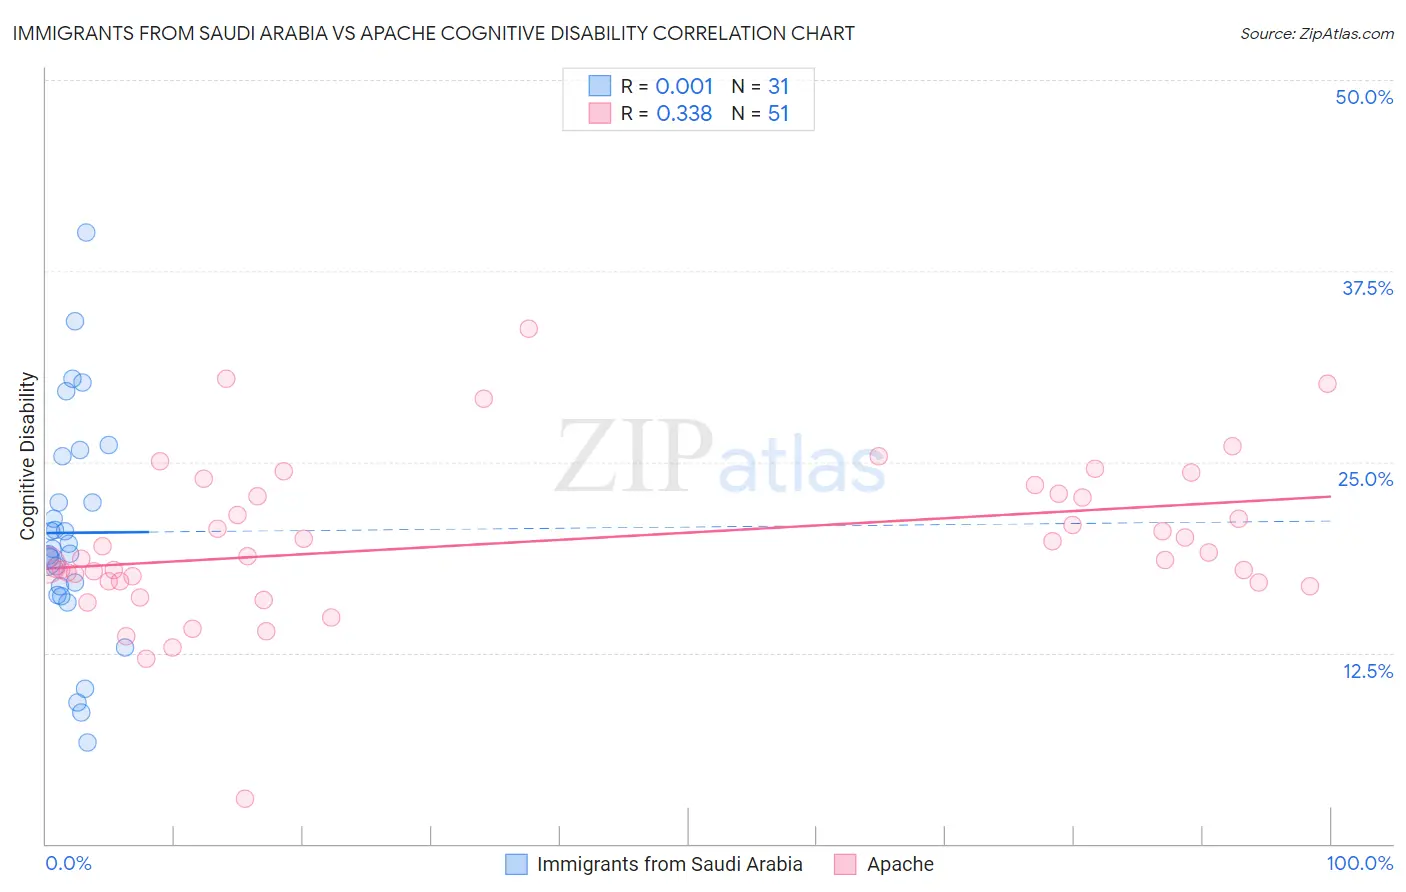
Immigrants from Saudi Arabia vs Apache Cognitive Disability Correlation Chart
The statistical analysis conducted on geographies consisting of 164,285,964 people shows no correlation between the proportion of Immigrants from Saudi Arabia and percentage of population with cognitive disability in the United States with a correlation coefficient (R) of 0.001 and weighted average of 19.1%. Similarly, the statistical analysis conducted on geographies consisting of 231,073,406 people shows a mild positive correlation between the proportion of Apache and percentage of population with cognitive disability in the United States with a correlation coefficient (R) of 0.338 and weighted average of 18.6%, a difference of 2.3%.
Cognitive Disability Correlation Summary
| Measurement | Immigrants from Saudi Arabia | Apache |
| Minimum | 6.6% | 2.9% |
| Maximum | 40.0% | 33.7% |
| Range | 33.4% | 30.8% |
| Mean | 20.4% | 19.8% |
| Median | 19.3% | 18.8% |
| Interquartile 25% (IQ1) | 16.3% | 17.2% |
| Interquartile 75% (IQ3) | 25.4% | 23.0% |
| Interquartile Range (IQR) | 9.1% | 5.8% |
| Standard Deviation (Sample) | 7.4% | 5.2% |
| Standard Deviation (Population) | 7.3% | 5.2% |
Demographics Similar to Immigrants from Saudi Arabia and Apache by Cognitive Disability
In terms of cognitive disability, the demographic groups most similar to Immigrants from Saudi Arabia are Black/African American (19.0%, a difference of 0.13%), Lumbee (19.1%, a difference of 0.34%), Senegalese (19.0%, a difference of 0.42%), Sudanese (18.9%, a difference of 0.97%), and Immigrants from Yemen (18.8%, a difference of 1.3%). Similarly, the demographic groups most similar to Apache are Comanche (18.6%, a difference of 0.040%), Bangladeshi (18.6%, a difference of 0.080%), African (18.6%, a difference of 0.090%), Immigrants from Liberia (18.7%, a difference of 0.16%), and Pueblo (18.7%, a difference of 0.17%).
| Demographics | Rating | Rank | Cognitive Disability |
| Bangladeshis | 0.0 /100 | #318 | Tragic 18.6% |
| Comanche | 0.0 /100 | #319 | Tragic 18.6% |
| Apache | 0.0 /100 | #320 | Tragic 18.6% |
| Africans | 0.0 /100 | #321 | Tragic 18.6% |
| Immigrants | Liberia | 0.0 /100 | #322 | Tragic 18.7% |
| Pueblo | 0.0 /100 | #323 | Tragic 18.7% |
| Dominicans | 0.0 /100 | #324 | Tragic 18.7% |
| Indonesians | 0.0 /100 | #325 | Tragic 18.7% |
| Immigrants | Senegal | 0.0 /100 | #326 | Tragic 18.7% |
| U.S. Virgin Islanders | 0.0 /100 | #327 | Tragic 18.7% |
| Kiowa | 0.0 /100 | #328 | Tragic 18.7% |
| Navajo | 0.0 /100 | #329 | Tragic 18.8% |
| Immigrants | Dominican Republic | 0.0 /100 | #330 | Tragic 18.8% |
| Pima | 0.0 /100 | #331 | Tragic 18.8% |
| Immigrants | Sudan | 0.0 /100 | #332 | Tragic 18.8% |
| Immigrants | Yemen | 0.0 /100 | #333 | Tragic 18.8% |
| Sudanese | 0.0 /100 | #334 | Tragic 18.9% |
| Senegalese | 0.0 /100 | #335 | Tragic 19.0% |
| Blacks/African Americans | 0.0 /100 | #336 | Tragic 19.0% |
| Immigrants | Saudi Arabia | 0.0 /100 | #337 | Tragic 19.1% |
| Lumbee | 0.0 /100 | #338 | Tragic 19.1% |