Immigrants from Romania vs Israeli Unemployment Among Youth under 25 years
COMPARE
Immigrants from Romania
Israeli
Unemployment Among Youth under 25 years
Unemployment Among Youth under 25 years Comparison
Immigrants from Romania
Israelis
11.5%
UNEMPLOYMENT AMONG YOUTH UNDER 25 YEARS
66.3/ 100
METRIC RATING
155th/ 347
METRIC RANK
12.0%
UNEMPLOYMENT AMONG YOUTH UNDER 25 YEARS
4.1/ 100
METRIC RATING
222nd/ 347
METRIC RANK
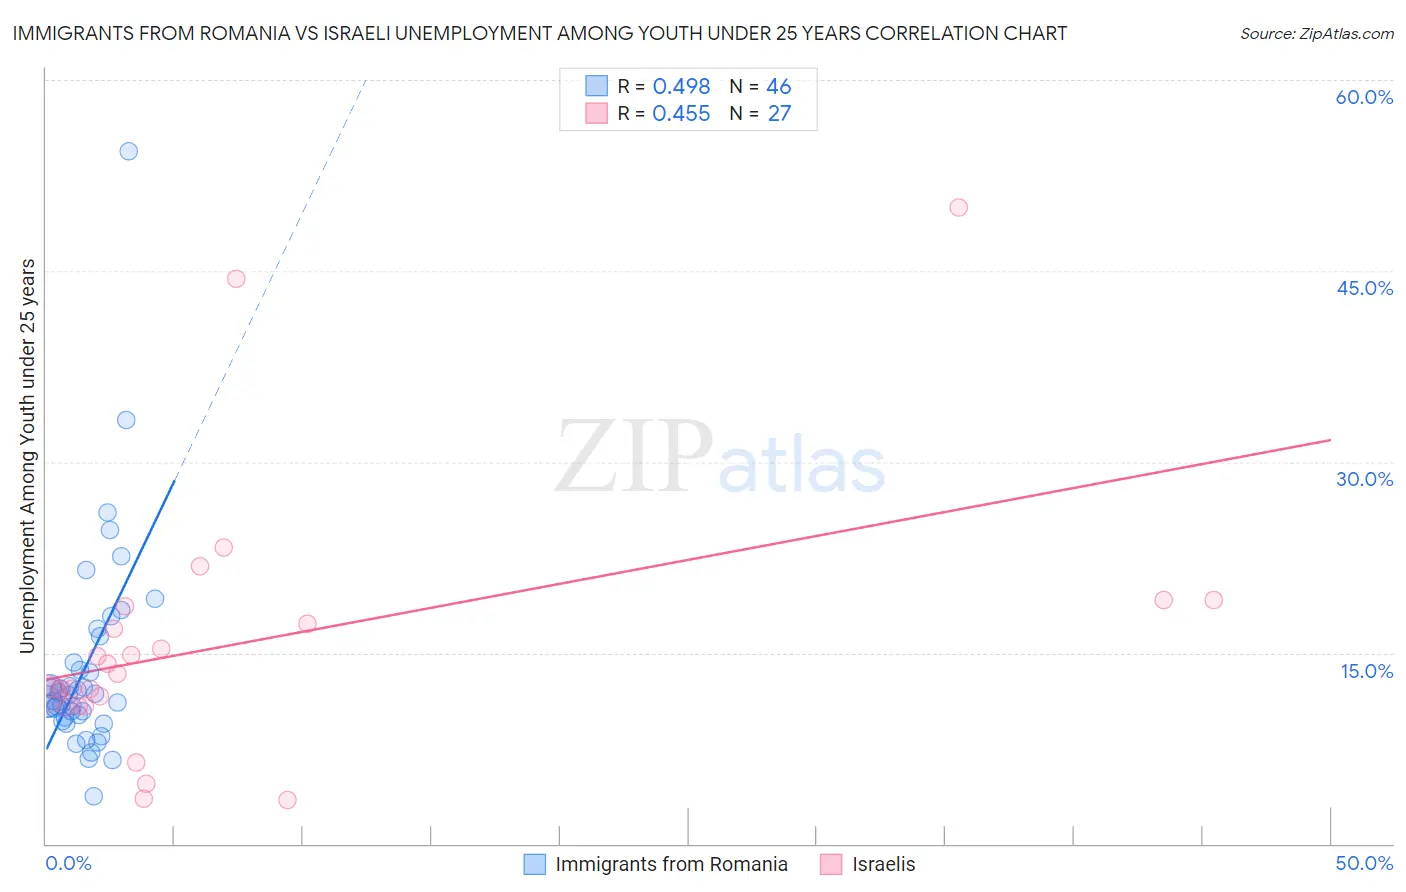
Immigrants from Romania vs Israeli Unemployment Among Youth under 25 years Correlation Chart
The statistical analysis conducted on geographies consisting of 255,276,474 people shows a moderate positive correlation between the proportion of Immigrants from Romania and unemployment rate among youth under the age of 25 in the United States with a correlation coefficient (R) of 0.498 and weighted average of 11.5%. Similarly, the statistical analysis conducted on geographies consisting of 210,036,405 people shows a moderate positive correlation between the proportion of Israelis and unemployment rate among youth under the age of 25 in the United States with a correlation coefficient (R) of 0.455 and weighted average of 12.0%, a difference of 4.0%.
Unemployment Among Youth under 25 years Correlation Summary
| Measurement | Immigrants from Romania | Israeli |
| Minimum | 3.7% | 3.4% |
| Maximum | 54.4% | 50.0% |
| Range | 50.7% | 46.6% |
| Mean | 13.8% | 15.8% |
| Median | 11.5% | 13.4% |
| Interquartile 25% (IQ1) | 9.9% | 10.8% |
| Interquartile 75% (IQ3) | 14.3% | 18.7% |
| Interquartile Range (IQR) | 4.3% | 7.8% |
| Standard Deviation (Sample) | 8.3% | 10.4% |
| Standard Deviation (Population) | 8.2% | 10.2% |
Similar Demographics by Unemployment Among Youth under 25 years
Demographics Similar to Immigrants from Romania by Unemployment Among Youth under 25 years
In terms of unemployment among youth under 25 years, the demographic groups most similar to Immigrants from Romania are Immigrants from Asia (11.5%, a difference of 0.020%), Immigrants from Germany (11.5%, a difference of 0.020%), Immigrants from Czechoslovakia (11.5%, a difference of 0.040%), Indian (Asian) (11.5%, a difference of 0.050%), and Immigrants from Turkey (11.5%, a difference of 0.070%).
| Demographics | Rating | Rank | Unemployment Among Youth under 25 years |
| Immigrants | Northern Europe | 72.1 /100 | #148 | Good 11.5% |
| Immigrants | Cambodia | 71.8 /100 | #149 | Good 11.5% |
| Immigrants | Switzerland | 71.6 /100 | #150 | Good 11.5% |
| Uruguayans | 70.4 /100 | #151 | Good 11.5% |
| Iraqis | 68.3 /100 | #152 | Good 11.5% |
| Immigrants | Czechoslovakia | 67.1 /100 | #153 | Good 11.5% |
| Immigrants | Asia | 66.7 /100 | #154 | Good 11.5% |
| Immigrants | Romania | 66.3 /100 | #155 | Good 11.5% |
| Immigrants | Germany | 65.9 /100 | #156 | Good 11.5% |
| Indians (Asian) | 65.1 /100 | #157 | Good 11.5% |
| Immigrants | Turkey | 64.8 /100 | #158 | Good 11.5% |
| Immigrants | Western Europe | 64.7 /100 | #159 | Good 11.5% |
| Immigrants | Eastern Asia | 64.5 /100 | #160 | Good 11.5% |
| Ukrainians | 64.3 /100 | #161 | Good 11.5% |
| Immigrants | Northern Africa | 62.7 /100 | #162 | Good 11.5% |
Demographics Similar to Israelis by Unemployment Among Youth under 25 years
In terms of unemployment among youth under 25 years, the demographic groups most similar to Israelis are Immigrants from Ireland (12.0%, a difference of 0.15%), Hawaiian (12.0%, a difference of 0.15%), Immigrants from Portugal (12.0%, a difference of 0.19%), Immigrants from Ukraine (12.0%, a difference of 0.30%), and Alsatian (11.9%, a difference of 0.42%).
| Demographics | Rating | Rank | Unemployment Among Youth under 25 years |
| Samoans | 7.4 /100 | #215 | Tragic 11.9% |
| Guamanians/Chamorros | 7.0 /100 | #216 | Tragic 11.9% |
| Yaqui | 6.9 /100 | #217 | Tragic 11.9% |
| Immigrants | Middle Africa | 6.8 /100 | #218 | Tragic 11.9% |
| Immigrants | Nonimmigrants | 6.2 /100 | #219 | Tragic 11.9% |
| Alsatians | 6.1 /100 | #220 | Tragic 11.9% |
| Immigrants | Portugal | 4.9 /100 | #221 | Tragic 12.0% |
| Israelis | 4.1 /100 | #222 | Tragic 12.0% |
| Immigrants | Ireland | 3.5 /100 | #223 | Tragic 12.0% |
| Hawaiians | 3.5 /100 | #224 | Tragic 12.0% |
| Immigrants | Ukraine | 3.0 /100 | #225 | Tragic 12.0% |
| Immigrants | Israel | 2.6 /100 | #226 | Tragic 12.0% |
| Immigrants | Iran | 2.6 /100 | #227 | Tragic 12.0% |
| Immigrants | Fiji | 2.1 /100 | #228 | Tragic 12.1% |
| Moroccans | 2.1 /100 | #229 | Tragic 12.1% |