Immigrants from Syria vs Paraguayan Disability Age Under 5
COMPARE
Immigrants from Syria
Paraguayan
Disability Age Under 5
Disability Age Under 5 Comparison
Immigrants from Syria
Paraguayans
1.1%
DISABILITY AGE UNDER 5
97.9/ 100
METRIC RATING
83rd/ 347
METRIC RANK
2.0%
DISABILITY AGE UNDER 5
0.0/ 100
METRIC RATING
336th/ 347
METRIC RANK
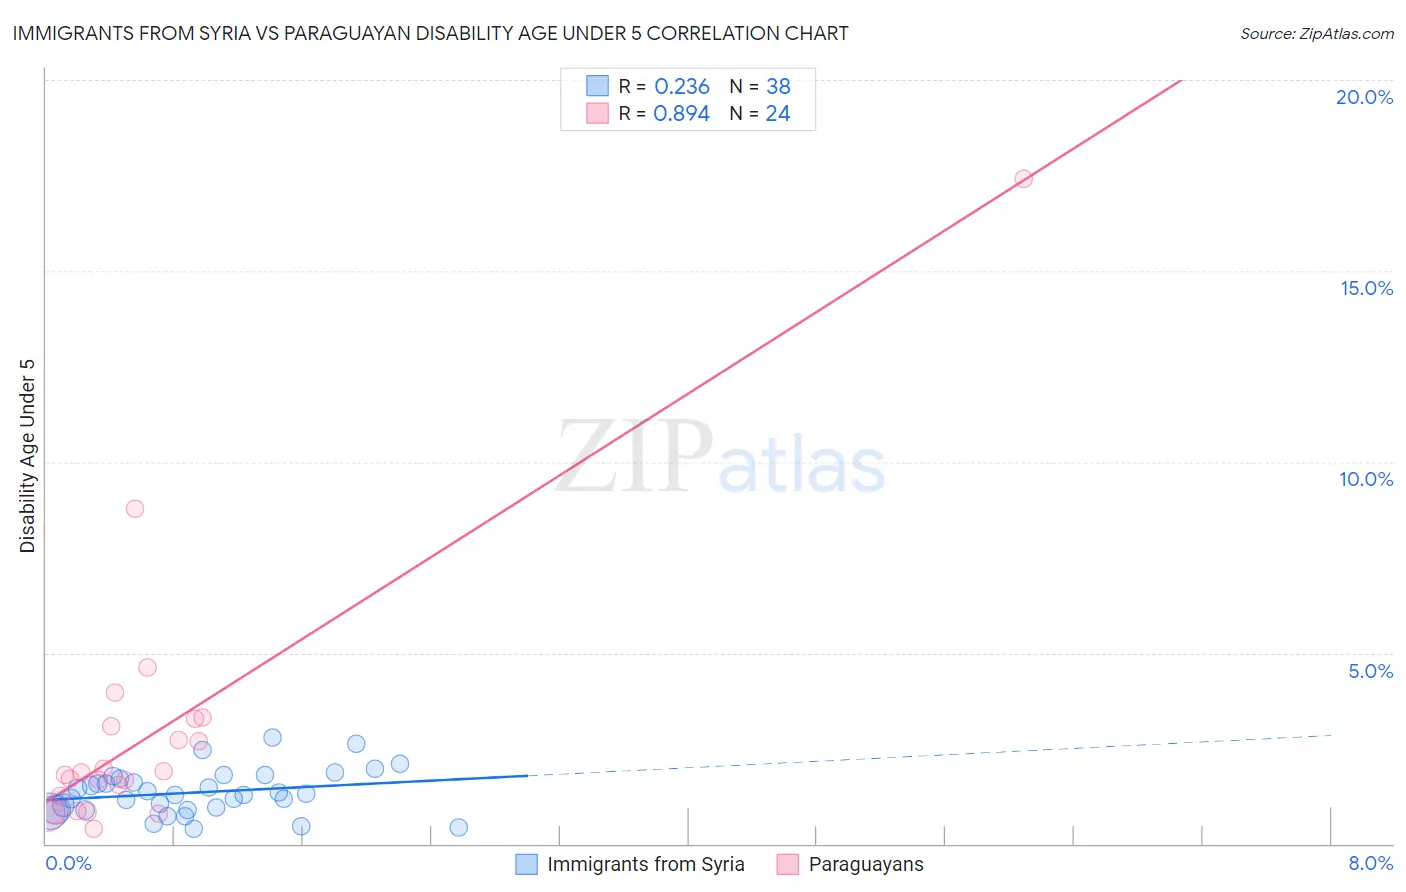
Immigrants from Syria vs Paraguayan Disability Age Under 5 Correlation Chart
The statistical analysis conducted on geographies consisting of 121,605,651 people shows a weak positive correlation between the proportion of Immigrants from Syria and percentage of population with a disability under the age of 5 in the United States with a correlation coefficient (R) of 0.236 and weighted average of 1.1%. Similarly, the statistical analysis conducted on geographies consisting of 72,027,201 people shows a very strong positive correlation between the proportion of Paraguayans and percentage of population with a disability under the age of 5 in the United States with a correlation coefficient (R) of 0.894 and weighted average of 2.0%, a difference of 74.4%.
Disability Age Under 5 Correlation Summary
| Measurement | Immigrants from Syria | Paraguayan |
| Minimum | 0.39% | 0.40% |
| Maximum | 2.8% | 17.4% |
| Range | 2.4% | 17.0% |
| Mean | 1.3% | 2.9% |
| Median | 1.3% | 1.8% |
| Interquartile 25% (IQ1) | 0.88% | 1.1% |
| Interquartile 75% (IQ3) | 1.7% | 3.2% |
| Interquartile Range (IQR) | 0.81% | 2.1% |
| Standard Deviation (Sample) | 0.58% | 3.6% |
| Standard Deviation (Population) | 0.57% | 3.5% |
Similar Demographics by Disability Age Under 5
Demographics Similar to Immigrants from Syria by Disability Age Under 5
In terms of disability age under 5, the demographic groups most similar to Immigrants from Syria are Immigrants from Jordan (1.1%, a difference of 0.010%), Turkish (1.1%, a difference of 0.12%), Immigrants from Trinidad and Tobago (1.1%, a difference of 0.14%), Immigrants from Zaire (1.1%, a difference of 0.15%), and Hmong (1.1%, a difference of 0.16%).
| Demographics | Rating | Rank | Disability Age Under 5 |
| Immigrants | Burma/Myanmar | 98.2 /100 | #76 | Exceptional 1.1% |
| Immigrants | Denmark | 98.1 /100 | #77 | Exceptional 1.1% |
| West Indians | 98.0 /100 | #78 | Exceptional 1.1% |
| Hmong | 98.0 /100 | #79 | Exceptional 1.1% |
| Immigrants | Trinidad and Tobago | 98.0 /100 | #80 | Exceptional 1.1% |
| Turks | 98.0 /100 | #81 | Exceptional 1.1% |
| Immigrants | Jordan | 97.9 /100 | #82 | Exceptional 1.1% |
| Immigrants | Syria | 97.9 /100 | #83 | Exceptional 1.1% |
| Immigrants | Zaire | 97.8 /100 | #84 | Exceptional 1.1% |
| Sudanese | 97.7 /100 | #85 | Exceptional 1.1% |
| Okinawans | 97.6 /100 | #86 | Exceptional 1.1% |
| Ugandans | 97.5 /100 | #87 | Exceptional 1.1% |
| Immigrants | Dominican Republic | 97.5 /100 | #88 | Exceptional 1.1% |
| Ethiopians | 97.2 /100 | #89 | Exceptional 1.1% |
| Chinese | 97.2 /100 | #90 | Exceptional 1.1% |
Demographics Similar to Paraguayans by Disability Age Under 5
In terms of disability age under 5, the demographic groups most similar to Paraguayans are Pennsylvania German (1.9%, a difference of 1.3%), Native/Alaskan (1.9%, a difference of 1.7%), Dutch West Indian (1.9%, a difference of 2.1%), Apache (2.0%, a difference of 2.9%), and Chippewa (1.9%, a difference of 5.1%).
| Demographics | Rating | Rank | Disability Age Under 5 |
| Houma | 0.0 /100 | #329 | Tragic 1.9% |
| Choctaw | 0.0 /100 | #330 | Tragic 1.9% |
| French Canadians | 0.0 /100 | #331 | Tragic 1.9% |
| Chippewa | 0.0 /100 | #332 | Tragic 1.9% |
| Dutch West Indians | 0.0 /100 | #333 | Tragic 1.9% |
| Natives/Alaskans | 0.0 /100 | #334 | Tragic 1.9% |
| Pennsylvania Germans | 0.0 /100 | #335 | Tragic 1.9% |
| Paraguayans | 0.0 /100 | #336 | Tragic 2.0% |
| Apache | 0.0 /100 | #337 | Tragic 2.0% |
| Tohono O'odham | 0.0 /100 | #338 | Tragic 2.2% |
| Immigrants | Azores | 0.0 /100 | #339 | Tragic 2.2% |
| Menominee | 0.0 /100 | #340 | Tragic 2.3% |
| Tsimshian | 0.0 /100 | #341 | Tragic 2.4% |
| Alaska Natives | 0.0 /100 | #342 | Tragic 2.9% |
| Colville | 0.0 /100 | #343 | Tragic 3.3% |