Immigrants from Poland vs Bolivian Hearing Disability
COMPARE
Immigrants from Poland
Bolivian
Hearing Disability
Hearing Disability Comparison
Immigrants from Poland
Bolivians
2.9%
HEARING DISABILITY
70.2/ 100
METRIC RATING
156th/ 347
METRIC RANK
2.6%
HEARING DISABILITY
99.7/ 100
METRIC RATING
29th/ 347
METRIC RANK
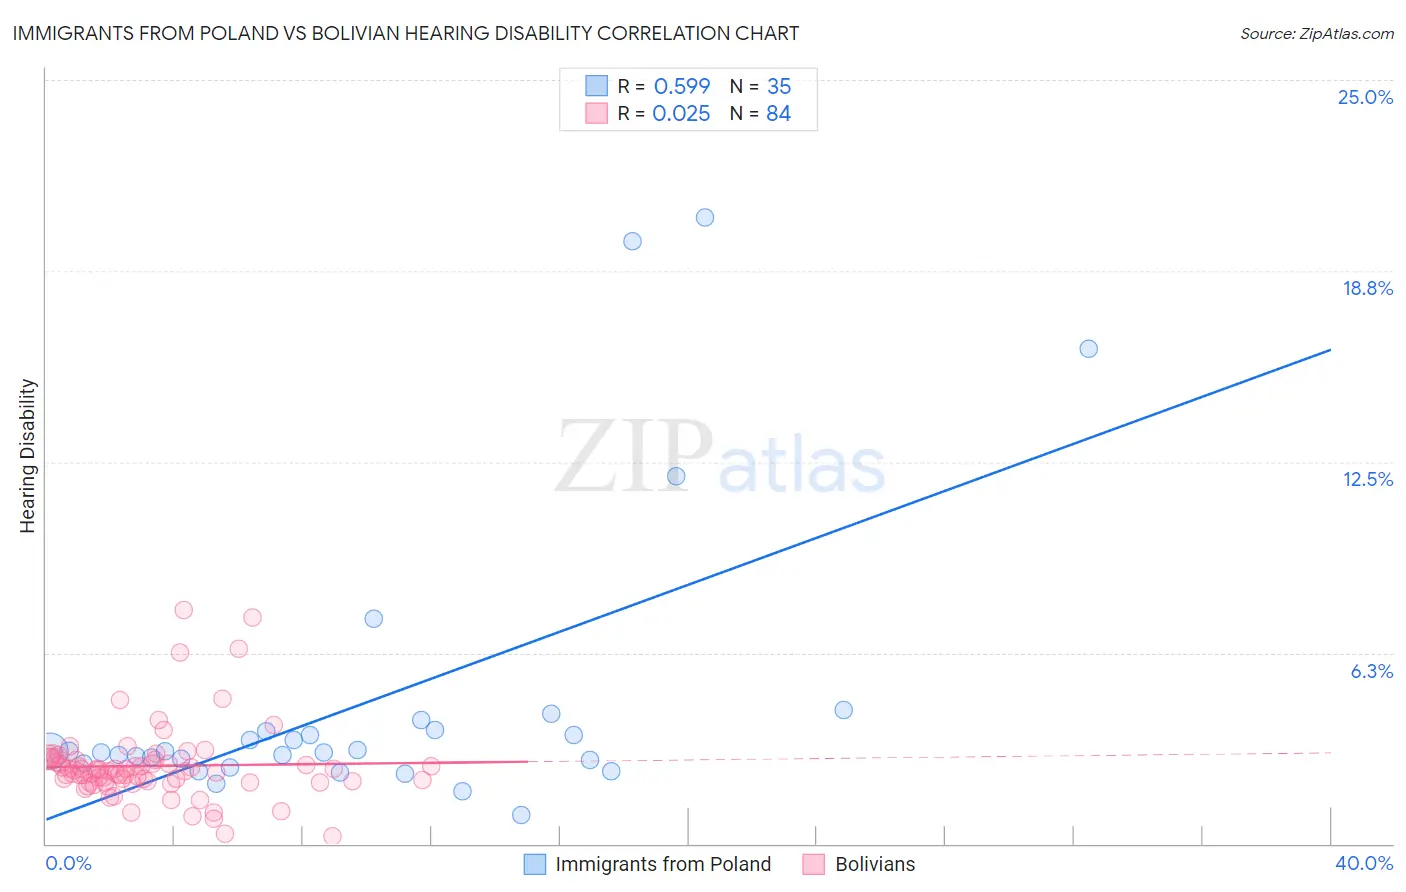
Immigrants from Poland vs Bolivian Hearing Disability Correlation Chart
The statistical analysis conducted on geographies consisting of 304,813,024 people shows a substantial positive correlation between the proportion of Immigrants from Poland and percentage of population with hearing disability in the United States with a correlation coefficient (R) of 0.599 and weighted average of 2.9%. Similarly, the statistical analysis conducted on geographies consisting of 184,637,856 people shows no correlation between the proportion of Bolivians and percentage of population with hearing disability in the United States with a correlation coefficient (R) of 0.025 and weighted average of 2.6%, a difference of 13.2%.
Hearing Disability Correlation Summary
| Measurement | Immigrants from Poland | Bolivian |
| Minimum | 0.95% | 0.24% |
| Maximum | 20.5% | 7.7% |
| Range | 19.6% | 7.4% |
| Mean | 4.7% | 2.5% |
| Median | 3.0% | 2.4% |
| Interquartile 25% (IQ1) | 2.6% | 2.0% |
| Interquartile 75% (IQ3) | 3.7% | 2.7% |
| Interquartile Range (IQR) | 1.1% | 0.70% |
| Standard Deviation (Sample) | 4.8% | 1.2% |
| Standard Deviation (Population) | 4.7% | 1.2% |
Similar Demographics by Hearing Disability
Demographics Similar to Immigrants from Poland by Hearing Disability
In terms of hearing disability, the demographic groups most similar to Immigrants from Poland are Immigrants from Kazakhstan (2.9%, a difference of 0.070%), Immigrants from Burma/Myanmar (2.9%, a difference of 0.080%), Costa Rican (2.9%, a difference of 0.14%), Immigrants from Lebanon (2.9%, a difference of 0.15%), and Sudanese (2.9%, a difference of 0.23%).
| Demographics | Rating | Rank | Hearing Disability |
| Immigrants | Panama | 76.9 /100 | #149 | Good 2.9% |
| Palestinians | 73.6 /100 | #150 | Good 2.9% |
| Immigrants | France | 73.1 /100 | #151 | Good 2.9% |
| Immigrants | Lithuania | 73.0 /100 | #152 | Good 2.9% |
| Sudanese | 72.1 /100 | #153 | Good 2.9% |
| Immigrants | Lebanon | 71.5 /100 | #154 | Good 2.9% |
| Costa Ricans | 71.4 /100 | #155 | Good 2.9% |
| Immigrants | Poland | 70.2 /100 | #156 | Good 2.9% |
| Immigrants | Kazakhstan | 69.6 /100 | #157 | Good 2.9% |
| Immigrants | Burma/Myanmar | 69.5 /100 | #158 | Good 2.9% |
| Immigrants | Australia | 67.4 /100 | #159 | Good 2.9% |
| Immigrants | Fiji | 67.1 /100 | #160 | Good 2.9% |
| Albanians | 66.6 /100 | #161 | Good 2.9% |
| Immigrants | Japan | 66.3 /100 | #162 | Good 2.9% |
| Immigrants | Central America | 64.9 /100 | #163 | Good 3.0% |
Demographics Similar to Bolivians by Hearing Disability
In terms of hearing disability, the demographic groups most similar to Bolivians are Immigrants from Haiti (2.6%, a difference of 0.020%), Immigrants from Caribbean (2.6%, a difference of 0.080%), Immigrants from Cameroon (2.6%, a difference of 0.090%), Immigrants from Venezuela (2.6%, a difference of 0.23%), and Immigrants from South Central Asia (2.6%, a difference of 0.40%).
| Demographics | Rating | Rank | Hearing Disability |
| Immigrants | Sierra Leone | 99.8 /100 | #22 | Exceptional 2.6% |
| Immigrants | Nigeria | 99.8 /100 | #23 | Exceptional 2.6% |
| Immigrants | Ghana | 99.8 /100 | #24 | Exceptional 2.6% |
| Immigrants | El Salvador | 99.7 /100 | #25 | Exceptional 2.6% |
| Immigrants | Senegal | 99.7 /100 | #26 | Exceptional 2.6% |
| Immigrants | South Central Asia | 99.7 /100 | #27 | Exceptional 2.6% |
| Immigrants | Haiti | 99.7 /100 | #28 | Exceptional 2.6% |
| Bolivians | 99.7 /100 | #29 | Exceptional 2.6% |
| Immigrants | Caribbean | 99.7 /100 | #30 | Exceptional 2.6% |
| Immigrants | Cameroon | 99.7 /100 | #31 | Exceptional 2.6% |
| Immigrants | Venezuela | 99.7 /100 | #32 | Exceptional 2.6% |
| Filipinos | 99.6 /100 | #33 | Exceptional 2.6% |
| Immigrants | Pakistan | 99.6 /100 | #34 | Exceptional 2.6% |
| Salvadorans | 99.6 /100 | #35 | Exceptional 2.6% |
| Okinawans | 99.6 /100 | #36 | Exceptional 2.6% |