Immigrants from Poland vs Austrian Hearing Disability
COMPARE
Immigrants from Poland
Austrian
Hearing Disability
Hearing Disability Comparison
Immigrants from Poland
Austrians
2.9%
HEARING DISABILITY
70.2/ 100
METRIC RATING
156th/ 347
METRIC RANK
3.4%
HEARING DISABILITY
0.6/ 100
METRIC RATING
248th/ 347
METRIC RANK
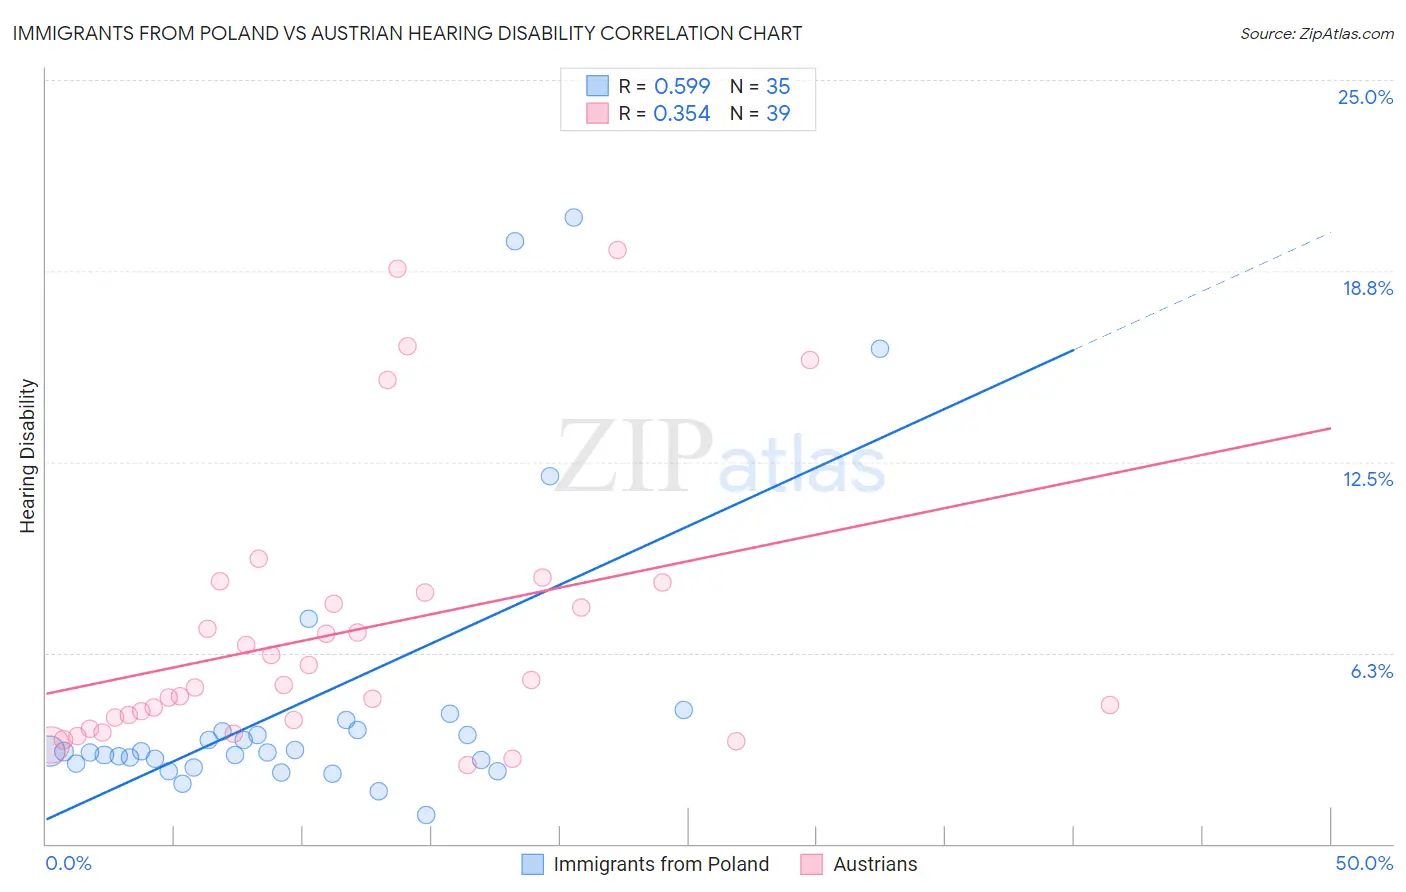
Immigrants from Poland vs Austrian Hearing Disability Correlation Chart
The statistical analysis conducted on geographies consisting of 304,813,024 people shows a substantial positive correlation between the proportion of Immigrants from Poland and percentage of population with hearing disability in the United States with a correlation coefficient (R) of 0.599 and weighted average of 2.9%. Similarly, the statistical analysis conducted on geographies consisting of 451,912,592 people shows a mild positive correlation between the proportion of Austrians and percentage of population with hearing disability in the United States with a correlation coefficient (R) of 0.354 and weighted average of 3.4%, a difference of 14.4%.
Hearing Disability Correlation Summary
| Measurement | Immigrants from Poland | Austrian |
| Minimum | 0.95% | 2.6% |
| Maximum | 20.5% | 19.4% |
| Range | 19.6% | 16.9% |
| Mean | 4.7% | 6.9% |
| Median | 3.0% | 5.2% |
| Interquartile 25% (IQ1) | 2.6% | 4.1% |
| Interquartile 75% (IQ3) | 3.7% | 8.2% |
| Interquartile Range (IQR) | 1.1% | 4.2% |
| Standard Deviation (Sample) | 4.8% | 4.4% |
| Standard Deviation (Population) | 4.7% | 4.3% |
Similar Demographics by Hearing Disability
Demographics Similar to Immigrants from Poland by Hearing Disability
In terms of hearing disability, the demographic groups most similar to Immigrants from Poland are Immigrants from Kazakhstan (2.9%, a difference of 0.070%), Immigrants from Burma/Myanmar (2.9%, a difference of 0.080%), Costa Rican (2.9%, a difference of 0.14%), Immigrants from Lebanon (2.9%, a difference of 0.15%), and Sudanese (2.9%, a difference of 0.23%).
| Demographics | Rating | Rank | Hearing Disability |
| Immigrants | Panama | 76.9 /100 | #149 | Good 2.9% |
| Palestinians | 73.6 /100 | #150 | Good 2.9% |
| Immigrants | France | 73.1 /100 | #151 | Good 2.9% |
| Immigrants | Lithuania | 73.0 /100 | #152 | Good 2.9% |
| Sudanese | 72.1 /100 | #153 | Good 2.9% |
| Immigrants | Lebanon | 71.5 /100 | #154 | Good 2.9% |
| Costa Ricans | 71.4 /100 | #155 | Good 2.9% |
| Immigrants | Poland | 70.2 /100 | #156 | Good 2.9% |
| Immigrants | Kazakhstan | 69.6 /100 | #157 | Good 2.9% |
| Immigrants | Burma/Myanmar | 69.5 /100 | #158 | Good 2.9% |
| Immigrants | Australia | 67.4 /100 | #159 | Good 2.9% |
| Immigrants | Fiji | 67.1 /100 | #160 | Good 2.9% |
| Albanians | 66.6 /100 | #161 | Good 2.9% |
| Immigrants | Japan | 66.3 /100 | #162 | Good 2.9% |
| Immigrants | Central America | 64.9 /100 | #163 | Good 3.0% |
Demographics Similar to Austrians by Hearing Disability
In terms of hearing disability, the demographic groups most similar to Austrians are Lithuanian (3.4%, a difference of 0.22%), Immigrants from England (3.3%, a difference of 0.42%), Italian (3.4%, a difference of 0.53%), Yuman (3.4%, a difference of 0.54%), and Immigrants from Scotland (3.3%, a difference of 0.71%).
| Demographics | Rating | Rank | Hearing Disability |
| Samoans | 1.1 /100 | #241 | Tragic 3.3% |
| Yugoslavians | 1.0 /100 | #242 | Tragic 3.3% |
| Immigrants | Western Europe | 1.0 /100 | #243 | Tragic 3.3% |
| Assyrians/Chaldeans/Syriacs | 0.9 /100 | #244 | Tragic 3.3% |
| Immigrants | Scotland | 0.8 /100 | #245 | Tragic 3.3% |
| Immigrants | England | 0.7 /100 | #246 | Tragic 3.3% |
| Lithuanians | 0.6 /100 | #247 | Tragic 3.4% |
| Austrians | 0.6 /100 | #248 | Tragic 3.4% |
| Italians | 0.4 /100 | #249 | Tragic 3.4% |
| Yuman | 0.4 /100 | #250 | Tragic 3.4% |
| Hungarians | 0.4 /100 | #251 | Tragic 3.4% |
| Croatians | 0.4 /100 | #252 | Tragic 3.4% |
| Carpatho Rusyns | 0.3 /100 | #253 | Tragic 3.4% |
| Slavs | 0.2 /100 | #254 | Tragic 3.4% |
| Poles | 0.2 /100 | #255 | Tragic 3.4% |