Tohono O'odham vs Brazilian Disability Age Under 5
COMPARE
Tohono O'odham
Brazilian
Disability Age Under 5
Disability Age Under 5 Comparison
Tohono O'odham
Brazilians
2.2%
DISABILITY AGE UNDER 5
0.0/ 100
METRIC RATING
338th/ 347
METRIC RANK
1.5%
DISABILITY AGE UNDER 5
0.0/ 100
METRIC RATING
275th/ 347
METRIC RANK
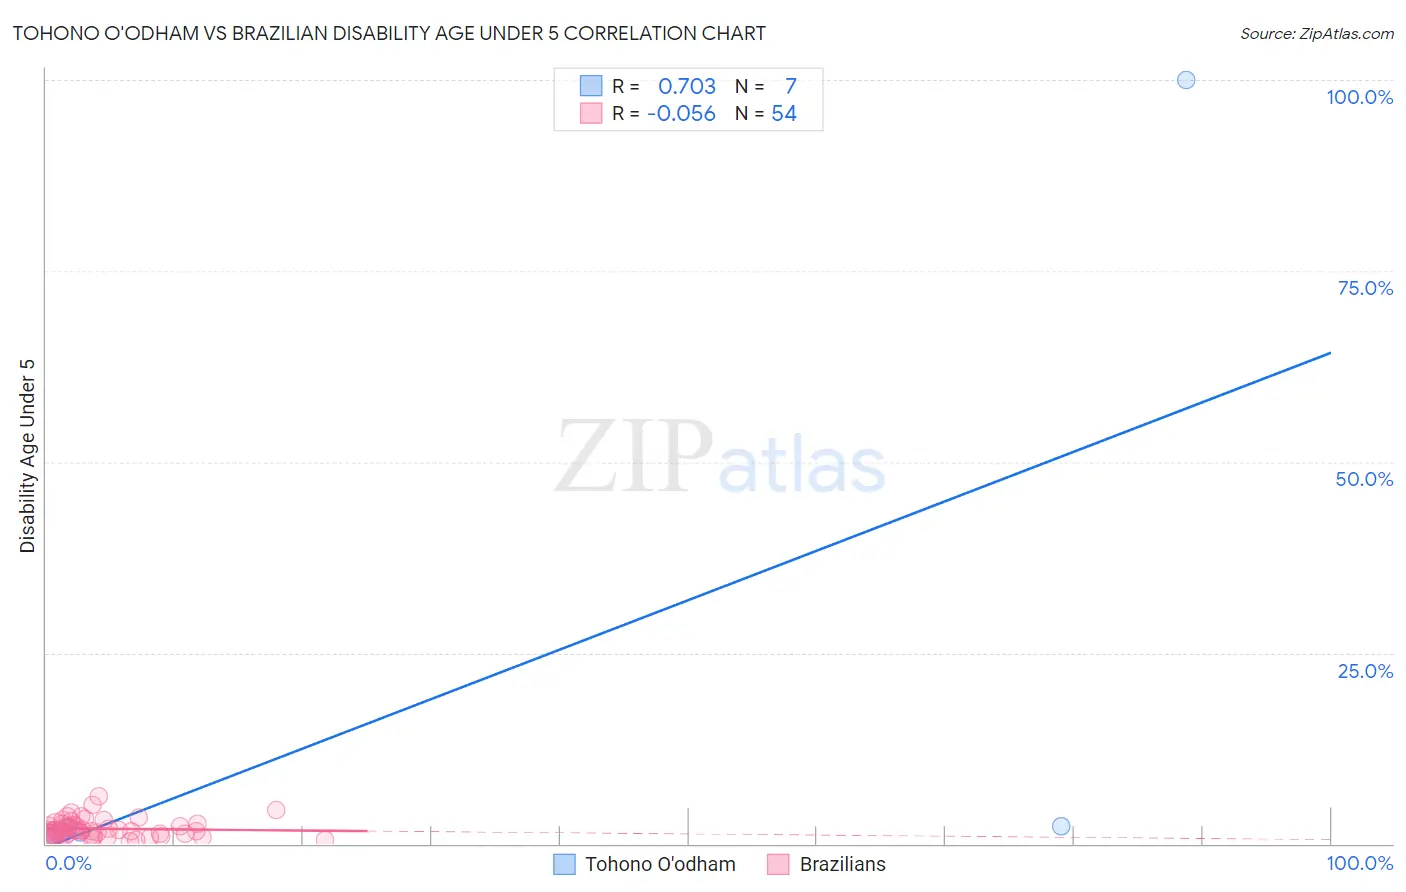
Tohono O'odham vs Brazilian Disability Age Under 5 Correlation Chart
The statistical analysis conducted on geographies consisting of 51,779,749 people shows a strong positive correlation between the proportion of Tohono O'odham and percentage of population with a disability under the age of 5 in the United States with a correlation coefficient (R) of 0.703 and weighted average of 2.2%. Similarly, the statistical analysis conducted on geographies consisting of 185,712,155 people shows a slight negative correlation between the proportion of Brazilians and percentage of population with a disability under the age of 5 in the United States with a correlation coefficient (R) of -0.056 and weighted average of 1.5%, a difference of 50.2%.
Disability Age Under 5 Correlation Summary
| Measurement | Tohono O'odham | Brazilian |
| Minimum | 0.81% | 0.34% |
| Maximum | 100.0% | 6.3% |
| Range | 99.2% | 6.0% |
| Mean | 15.6% | 2.0% |
| Median | 1.6% | 1.7% |
| Interquartile 25% (IQ1) | 1.0% | 1.1% |
| Interquartile 75% (IQ3) | 2.3% | 2.5% |
| Interquartile Range (IQR) | 1.2% | 1.5% |
| Standard Deviation (Sample) | 37.2% | 1.2% |
| Standard Deviation (Population) | 34.5% | 1.2% |
Similar Demographics by Disability Age Under 5
Demographics Similar to Tohono O'odham by Disability Age Under 5
In terms of disability age under 5, the demographic groups most similar to Tohono O'odham are Immigrants from the Azores (2.2%, a difference of 2.2%), Menominee (2.3%, a difference of 5.0%), Apache (2.0%, a difference of 7.6%), Tsimshian (2.4%, a difference of 10.2%), and Paraguayan (2.0%, a difference of 10.7%).
| Demographics | Rating | Rank | Disability Age Under 5 |
| French Canadians | 0.0 /100 | #331 | Tragic 1.9% |
| Chippewa | 0.0 /100 | #332 | Tragic 1.9% |
| Dutch West Indians | 0.0 /100 | #333 | Tragic 1.9% |
| Natives/Alaskans | 0.0 /100 | #334 | Tragic 1.9% |
| Pennsylvania Germans | 0.0 /100 | #335 | Tragic 1.9% |
| Paraguayans | 0.0 /100 | #336 | Tragic 2.0% |
| Apache | 0.0 /100 | #337 | Tragic 2.0% |
| Tohono O'odham | 0.0 /100 | #338 | Tragic 2.2% |
| Immigrants | Azores | 0.0 /100 | #339 | Tragic 2.2% |
| Menominee | 0.0 /100 | #340 | Tragic 2.3% |
| Tsimshian | 0.0 /100 | #341 | Tragic 2.4% |
| Alaska Natives | 0.0 /100 | #342 | Tragic 2.9% |
| Colville | 0.0 /100 | #343 | Tragic 3.3% |
| Inupiat | 0.0 /100 | #344 | Tragic 3.7% |
| Paiute | 0.0 /100 | #345 | Tragic 3.9% |
Demographics Similar to Brazilians by Disability Age Under 5
In terms of disability age under 5, the demographic groups most similar to Brazilians are Iroquois (1.5%, a difference of 0.11%), Alaskan Athabascan (1.5%, a difference of 0.38%), Greek (1.5%, a difference of 0.57%), Black/African American (1.4%, a difference of 0.67%), and Immigrants from Canada (1.4%, a difference of 0.83%).
| Demographics | Rating | Rank | Disability Age Under 5 |
| Belgians | 0.1 /100 | #268 | Tragic 1.4% |
| Austrians | 0.1 /100 | #269 | Tragic 1.4% |
| Immigrants | North America | 0.1 /100 | #270 | Tragic 1.4% |
| Immigrants | Canada | 0.1 /100 | #271 | Tragic 1.4% |
| Blacks/African Americans | 0.1 /100 | #272 | Tragic 1.4% |
| Alaskan Athabascans | 0.1 /100 | #273 | Tragic 1.5% |
| Iroquois | 0.0 /100 | #274 | Tragic 1.5% |
| Brazilians | 0.0 /100 | #275 | Tragic 1.5% |
| Greeks | 0.0 /100 | #276 | Tragic 1.5% |
| Canadians | 0.0 /100 | #277 | Tragic 1.5% |
| Kiowa | 0.0 /100 | #278 | Tragic 1.5% |
| Danes | 0.0 /100 | #279 | Tragic 1.5% |
| British | 0.0 /100 | #280 | Tragic 1.5% |
| Czechoslovakians | 0.0 /100 | #281 | Tragic 1.5% |
| Cheyenne | 0.0 /100 | #282 | Tragic 1.5% |