Immigrants from Peru vs Dutch Hearing Disability
COMPARE
Immigrants from Peru
Dutch
Hearing Disability
Hearing Disability Comparison
Immigrants from Peru
Dutch
2.7%
HEARING DISABILITY
98.6/ 100
METRIC RATING
58th/ 347
METRIC RANK
3.7%
HEARING DISABILITY
0.0/ 100
METRIC RATING
302nd/ 347
METRIC RANK
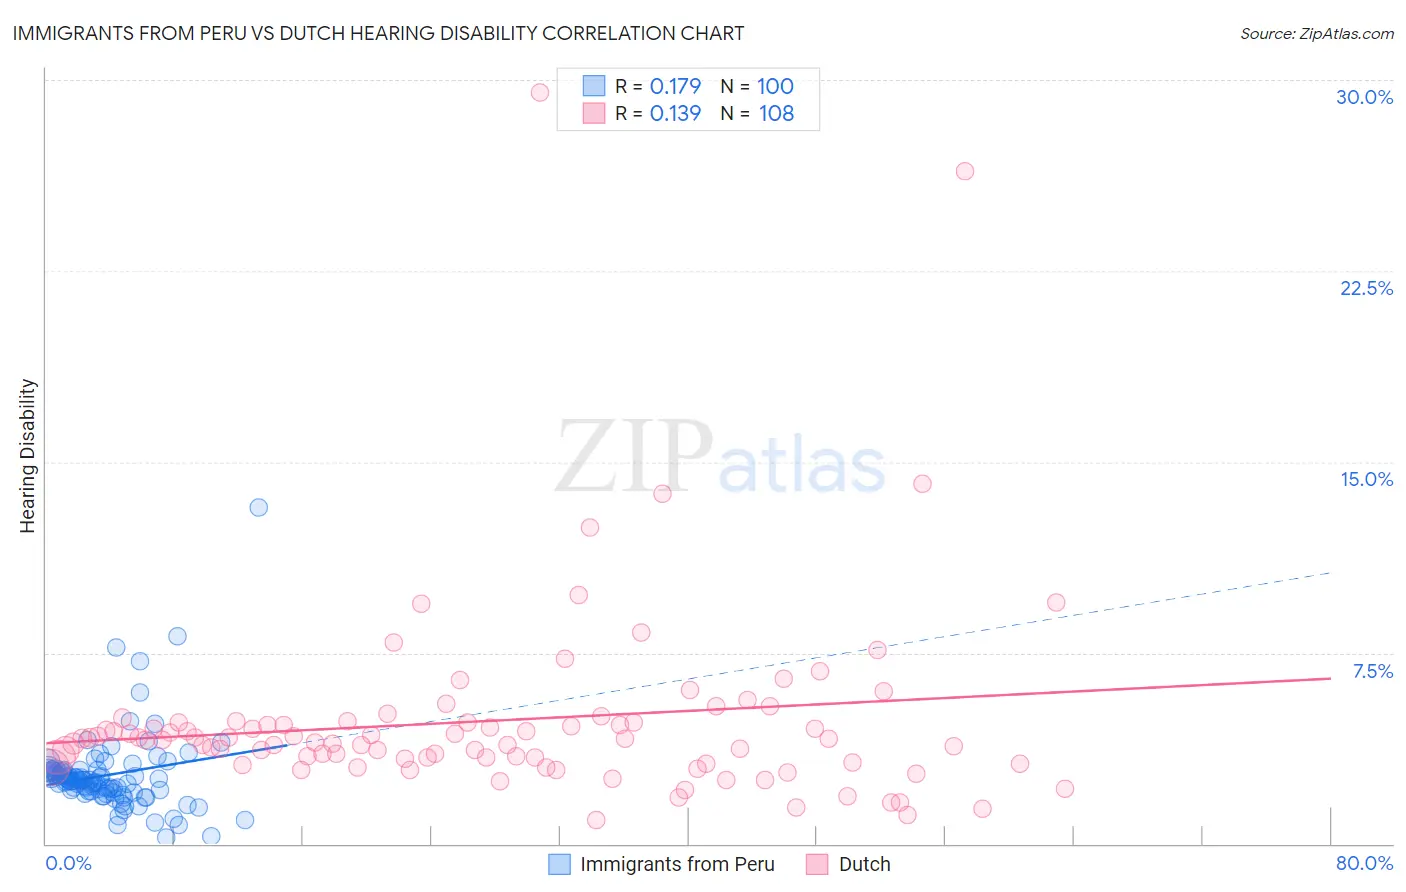
Immigrants from Peru vs Dutch Hearing Disability Correlation Chart
The statistical analysis conducted on geographies consisting of 328,787,058 people shows a poor positive correlation between the proportion of Immigrants from Peru and percentage of population with hearing disability in the United States with a correlation coefficient (R) of 0.179 and weighted average of 2.7%. Similarly, the statistical analysis conducted on geographies consisting of 553,868,421 people shows a poor positive correlation between the proportion of Dutch and percentage of population with hearing disability in the United States with a correlation coefficient (R) of 0.139 and weighted average of 3.7%, a difference of 38.7%.
Hearing Disability Correlation Summary
| Measurement | Immigrants from Peru | Dutch |
| Minimum | 0.24% | 0.93% |
| Maximum | 13.2% | 29.5% |
| Range | 13.0% | 28.6% |
| Mean | 2.7% | 4.8% |
| Median | 2.5% | 4.1% |
| Interquartile 25% (IQ1) | 2.0% | 3.3% |
| Interquartile 75% (IQ3) | 2.9% | 4.8% |
| Interquartile Range (IQR) | 0.85% | 1.5% |
| Standard Deviation (Sample) | 1.6% | 3.9% |
| Standard Deviation (Population) | 1.6% | 3.9% |
Similar Demographics by Hearing Disability
Demographics Similar to Immigrants from Peru by Hearing Disability
In terms of hearing disability, the demographic groups most similar to Immigrants from Peru are Immigrants from Eritrea (2.7%, a difference of 0.11%), Immigrants from Egypt (2.7%, a difference of 0.18%), Immigrants from Uzbekistan (2.7%, a difference of 0.31%), Immigrants from Colombia (2.7%, a difference of 0.32%), and Indian (Asian) (2.7%, a difference of 0.37%).
| Demographics | Rating | Rank | Hearing Disability |
| Immigrants | Hong Kong | 99.2 /100 | #51 | Exceptional 2.7% |
| Jamaicans | 99.0 /100 | #52 | Exceptional 2.7% |
| Immigrants | Eastern Asia | 99.0 /100 | #53 | Exceptional 2.7% |
| Ethiopians | 99.0 /100 | #54 | Exceptional 2.7% |
| Immigrants | Ethiopia | 99.0 /100 | #55 | Exceptional 2.7% |
| Immigrants | Nicaragua | 99.0 /100 | #56 | Exceptional 2.7% |
| South Americans | 99.0 /100 | #57 | Exceptional 2.7% |
| Immigrants | Peru | 98.6 /100 | #58 | Exceptional 2.7% |
| Immigrants | Eritrea | 98.5 /100 | #59 | Exceptional 2.7% |
| Immigrants | Egypt | 98.5 /100 | #60 | Exceptional 2.7% |
| Immigrants | Uzbekistan | 98.4 /100 | #61 | Exceptional 2.7% |
| Immigrants | Colombia | 98.4 /100 | #62 | Exceptional 2.7% |
| Indians (Asian) | 98.4 /100 | #63 | Exceptional 2.7% |
| Immigrants | Sri Lanka | 98.4 /100 | #64 | Exceptional 2.7% |
| Immigrants | Nepal | 98.3 /100 | #65 | Exceptional 2.7% |
Demographics Similar to Dutch by Hearing Disability
In terms of hearing disability, the demographic groups most similar to Dutch are Menominee (3.7%, a difference of 0.060%), Pennsylvania German (3.7%, a difference of 0.11%), Scottish (3.7%, a difference of 0.13%), German (3.7%, a difference of 0.20%), and French (3.8%, a difference of 0.36%).
| Demographics | Rating | Rank | Hearing Disability |
| Welsh | 0.0 /100 | #295 | Tragic 3.7% |
| Pima | 0.0 /100 | #296 | Tragic 3.7% |
| Immigrants | Azores | 0.0 /100 | #297 | Tragic 3.7% |
| Celtics | 0.0 /100 | #298 | Tragic 3.7% |
| Germans | 0.0 /100 | #299 | Tragic 3.7% |
| Scottish | 0.0 /100 | #300 | Tragic 3.7% |
| Pennsylvania Germans | 0.0 /100 | #301 | Tragic 3.7% |
| Dutch | 0.0 /100 | #302 | Tragic 3.7% |
| Menominee | 0.0 /100 | #303 | Tragic 3.7% |
| French | 0.0 /100 | #304 | Tragic 3.8% |
| English | 0.0 /100 | #305 | Tragic 3.8% |
| Marshallese | 0.0 /100 | #306 | Tragic 3.8% |
| French Canadians | 0.0 /100 | #307 | Tragic 3.8% |
| Ottawa | 0.0 /100 | #308 | Tragic 3.8% |
| Scotch-Irish | 0.0 /100 | #309 | Tragic 3.8% |