Immigrants from Panama vs Yuman Female Disability
COMPARE
Immigrants from Panama
Yuman
Female Disability
Female Disability Comparison
Immigrants from Panama
Yuman
12.3%
FEMALE DISABILITY
25.5/ 100
METRIC RATING
196th/ 347
METRIC RANK
14.5%
FEMALE DISABILITY
0.0/ 100
METRIC RATING
330th/ 347
METRIC RANK
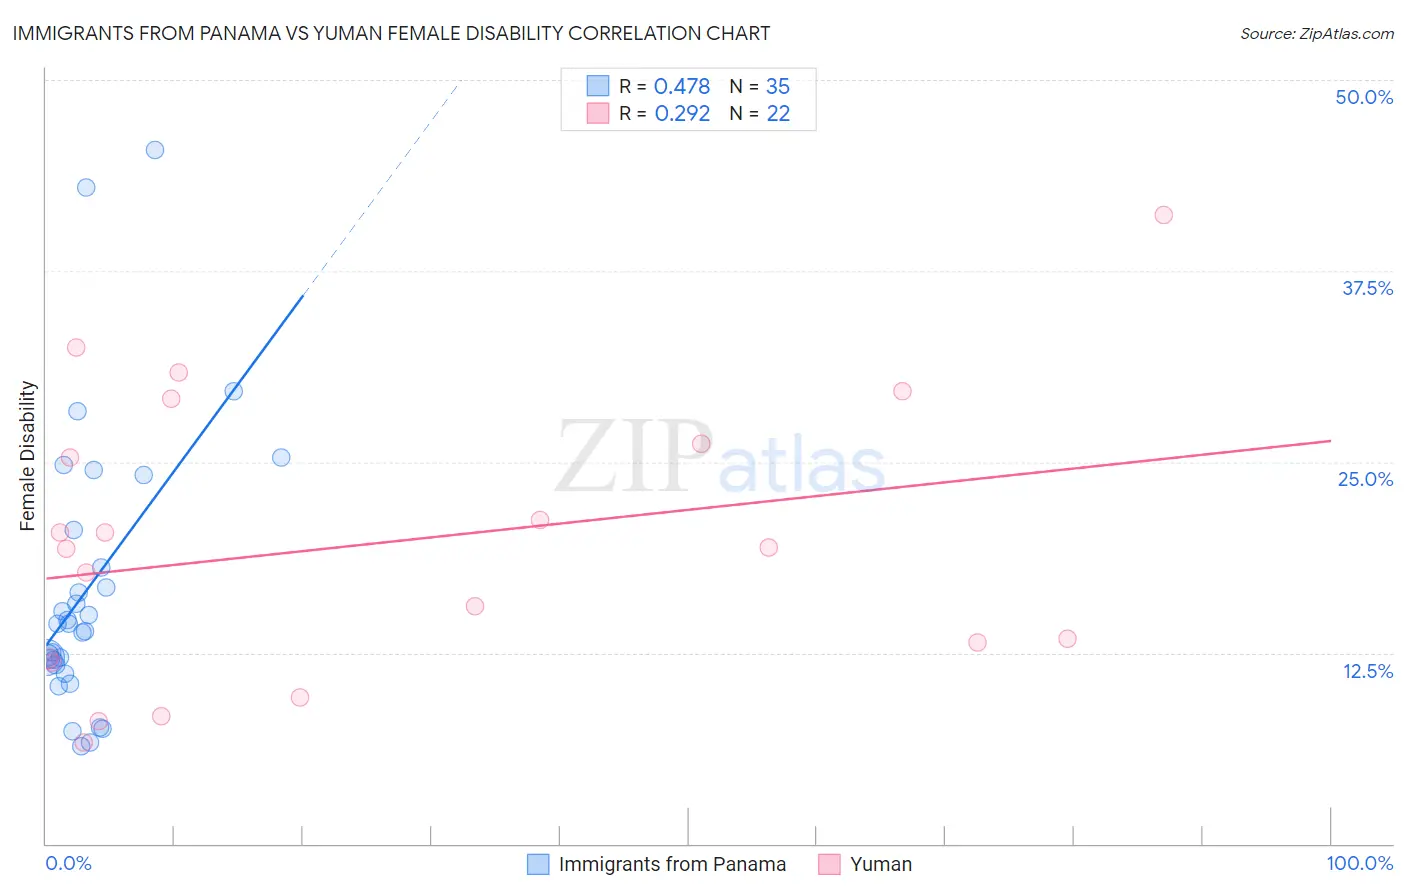
Immigrants from Panama vs Yuman Female Disability Correlation Chart
The statistical analysis conducted on geographies consisting of 221,176,996 people shows a moderate positive correlation between the proportion of Immigrants from Panama and percentage of females with a disability in the United States with a correlation coefficient (R) of 0.478 and weighted average of 12.3%. Similarly, the statistical analysis conducted on geographies consisting of 40,663,029 people shows a weak positive correlation between the proportion of Yuman and percentage of females with a disability in the United States with a correlation coefficient (R) of 0.292 and weighted average of 14.5%, a difference of 17.7%.
Female Disability Correlation Summary
| Measurement | Immigrants from Panama | Yuman |
| Minimum | 6.4% | 6.6% |
| Maximum | 45.5% | 41.2% |
| Range | 39.1% | 34.6% |
| Mean | 16.8% | 19.6% |
| Median | 14.4% | 19.4% |
| Interquartile 25% (IQ1) | 11.7% | 12.1% |
| Interquartile 75% (IQ3) | 20.5% | 26.2% |
| Interquartile Range (IQR) | 8.8% | 14.0% |
| Standard Deviation (Sample) | 9.1% | 9.2% |
| Standard Deviation (Population) | 9.0% | 9.0% |
Similar Demographics by Female Disability
Demographics Similar to Immigrants from Panama by Female Disability
In terms of female disability, the demographic groups most similar to Immigrants from Panama are Honduran (12.3%, a difference of 0.0%), Mexican American Indian (12.3%, a difference of 0.030%), Immigrants from Trinidad and Tobago (12.3%, a difference of 0.040%), Swedish (12.3%, a difference of 0.060%), and Ukrainian (12.3%, a difference of 0.080%).
| Demographics | Rating | Rank | Female Disability |
| Immigrants | Albania | 31.6 /100 | #189 | Fair 12.3% |
| Immigrants | Honduras | 31.3 /100 | #190 | Fair 12.3% |
| Armenians | 29.7 /100 | #191 | Fair 12.3% |
| Immigrants | Western Africa | 29.2 /100 | #192 | Fair 12.3% |
| Northern Europeans | 27.5 /100 | #193 | Fair 12.3% |
| Ukrainians | 27.2 /100 | #194 | Fair 12.3% |
| Swedes | 26.6 /100 | #195 | Fair 12.3% |
| Immigrants | Panama | 25.5 /100 | #196 | Fair 12.3% |
| Hondurans | 25.4 /100 | #197 | Fair 12.3% |
| Mexican American Indians | 24.9 /100 | #198 | Fair 12.3% |
| Immigrants | Trinidad and Tobago | 24.7 /100 | #199 | Fair 12.3% |
| Trinidadians and Tobagonians | 22.4 /100 | #200 | Fair 12.3% |
| Chinese | 22.1 /100 | #201 | Fair 12.3% |
| Somalis | 21.5 /100 | #202 | Fair 12.3% |
| Immigrants | Barbados | 21.1 /100 | #203 | Fair 12.3% |
Demographics Similar to Yuman by Female Disability
In terms of female disability, the demographic groups most similar to Yuman are Immigrants from Cabo Verde (14.6%, a difference of 0.42%), Osage (14.3%, a difference of 1.4%), Ottawa (14.2%, a difference of 1.8%), Cape Verdean (14.2%, a difference of 1.8%), and Pima (14.8%, a difference of 2.0%).
| Demographics | Rating | Rank | Female Disability |
| Blacks/African Americans | 0.0 /100 | #323 | Tragic 14.1% |
| Natives/Alaskans | 0.0 /100 | #324 | Tragic 14.1% |
| Navajo | 0.0 /100 | #325 | Tragic 14.2% |
| Comanche | 0.0 /100 | #326 | Tragic 14.2% |
| Ottawa | 0.0 /100 | #327 | Tragic 14.2% |
| Cape Verdeans | 0.0 /100 | #328 | Tragic 14.2% |
| Osage | 0.0 /100 | #329 | Tragic 14.3% |
| Yuman | 0.0 /100 | #330 | Tragic 14.5% |
| Immigrants | Cabo Verde | 0.0 /100 | #331 | Tragic 14.6% |
| Pima | 0.0 /100 | #332 | Tragic 14.8% |
| Immigrants | Azores | 0.0 /100 | #333 | Tragic 14.9% |
| Cherokee | 0.0 /100 | #334 | Tragic 14.9% |
| Cajuns | 0.0 /100 | #335 | Tragic 14.9% |
| Seminole | 0.0 /100 | #336 | Tragic 15.0% |
| Tohono O'odham | 0.0 /100 | #337 | Tragic 15.0% |