Immigrants from Panama vs Albanian Female Disability
COMPARE
Immigrants from Panama
Albanian
Female Disability
Female Disability Comparison
Immigrants from Panama
Albanians
12.3%
FEMALE DISABILITY
25.5/ 100
METRIC RATING
196th/ 347
METRIC RANK
12.3%
FEMALE DISABILITY
37.9/ 100
METRIC RATING
180th/ 347
METRIC RANK
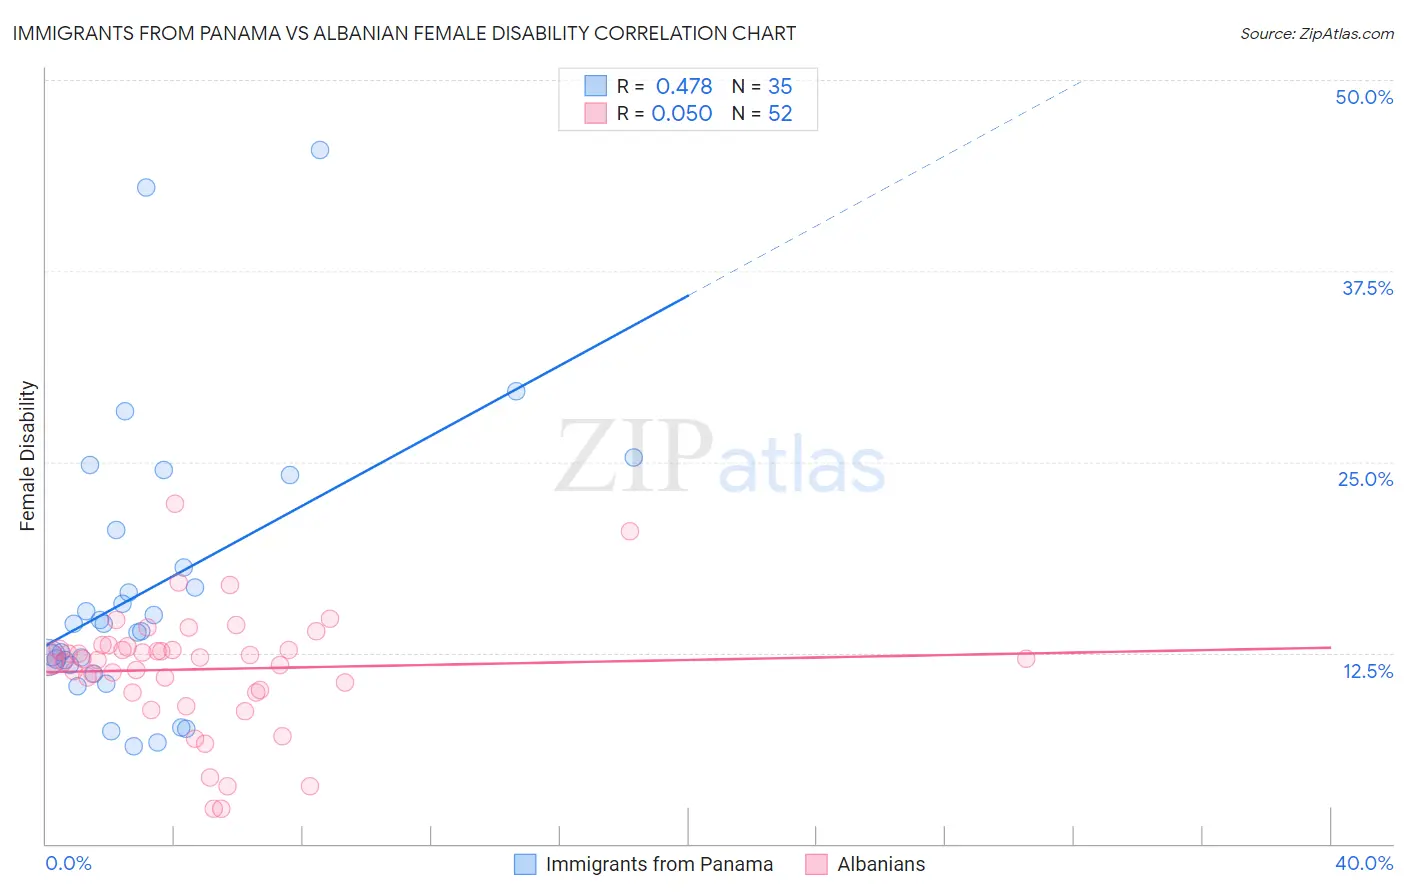
Immigrants from Panama vs Albanian Female Disability Correlation Chart
The statistical analysis conducted on geographies consisting of 221,176,996 people shows a moderate positive correlation between the proportion of Immigrants from Panama and percentage of females with a disability in the United States with a correlation coefficient (R) of 0.478 and weighted average of 12.3%. Similarly, the statistical analysis conducted on geographies consisting of 193,264,096 people shows no correlation between the proportion of Albanians and percentage of females with a disability in the United States with a correlation coefficient (R) of 0.050 and weighted average of 12.3%, a difference of 0.54%.
Female Disability Correlation Summary
| Measurement | Immigrants from Panama | Albanian |
| Minimum | 6.4% | 2.3% |
| Maximum | 45.5% | 22.2% |
| Range | 39.1% | 20.0% |
| Mean | 16.8% | 11.4% |
| Median | 14.4% | 12.1% |
| Interquartile 25% (IQ1) | 11.7% | 10.0% |
| Interquartile 75% (IQ3) | 20.5% | 12.8% |
| Interquartile Range (IQR) | 8.8% | 2.8% |
| Standard Deviation (Sample) | 9.1% | 3.9% |
| Standard Deviation (Population) | 9.0% | 3.8% |
Demographics Similar to Immigrants from Panama and Albanians by Female Disability
In terms of female disability, the demographic groups most similar to Immigrants from Panama are Honduran (12.3%, a difference of 0.0%), Mexican American Indian (12.3%, a difference of 0.030%), Swedish (12.3%, a difference of 0.060%), Ukrainian (12.3%, a difference of 0.080%), and Northern European (12.3%, a difference of 0.10%). Similarly, the demographic groups most similar to Albanians are Immigrants from Fiji (12.3%, a difference of 0.010%), Immigrants from Canada (12.3%, a difference of 0.030%), Norwegian (12.3%, a difference of 0.040%), Cuban (12.3%, a difference of 0.060%), and Iraqi (12.3%, a difference of 0.080%).
| Demographics | Rating | Rank | Female Disability |
| Immigrants | Western Europe | 40.9 /100 | #178 | Average 12.2% |
| Immigrants | Fiji | 38.2 /100 | #179 | Fair 12.3% |
| Albanians | 37.9 /100 | #180 | Fair 12.3% |
| Immigrants | Canada | 37.2 /100 | #181 | Fair 12.3% |
| Norwegians | 36.9 /100 | #182 | Fair 12.3% |
| Cubans | 36.5 /100 | #183 | Fair 12.3% |
| Iraqis | 36.0 /100 | #184 | Fair 12.3% |
| Immigrants | Uzbekistan | 33.9 /100 | #185 | Fair 12.3% |
| Austrians | 33.3 /100 | #186 | Fair 12.3% |
| Serbians | 33.1 /100 | #187 | Fair 12.3% |
| Immigrants | North America | 32.8 /100 | #188 | Fair 12.3% |
| Immigrants | Albania | 31.6 /100 | #189 | Fair 12.3% |
| Immigrants | Honduras | 31.3 /100 | #190 | Fair 12.3% |
| Armenians | 29.7 /100 | #191 | Fair 12.3% |
| Immigrants | Western Africa | 29.2 /100 | #192 | Fair 12.3% |
| Northern Europeans | 27.5 /100 | #193 | Fair 12.3% |
| Ukrainians | 27.2 /100 | #194 | Fair 12.3% |
| Swedes | 26.6 /100 | #195 | Fair 12.3% |
| Immigrants | Panama | 25.5 /100 | #196 | Fair 12.3% |
| Hondurans | 25.4 /100 | #197 | Fair 12.3% |
| Mexican American Indians | 24.9 /100 | #198 | Fair 12.3% |