Immigrants from Norway vs Venezuelan 11th Grade
COMPARE
Immigrants from Norway
Venezuelan
11th Grade
11th Grade Comparison
Immigrants from Norway
Venezuelans
93.5%
11TH GRADE
98.4/ 100
METRIC RATING
107th/ 347
METRIC RANK
92.9%
11TH GRADE
83.4/ 100
METRIC RATING
140th/ 347
METRIC RANK
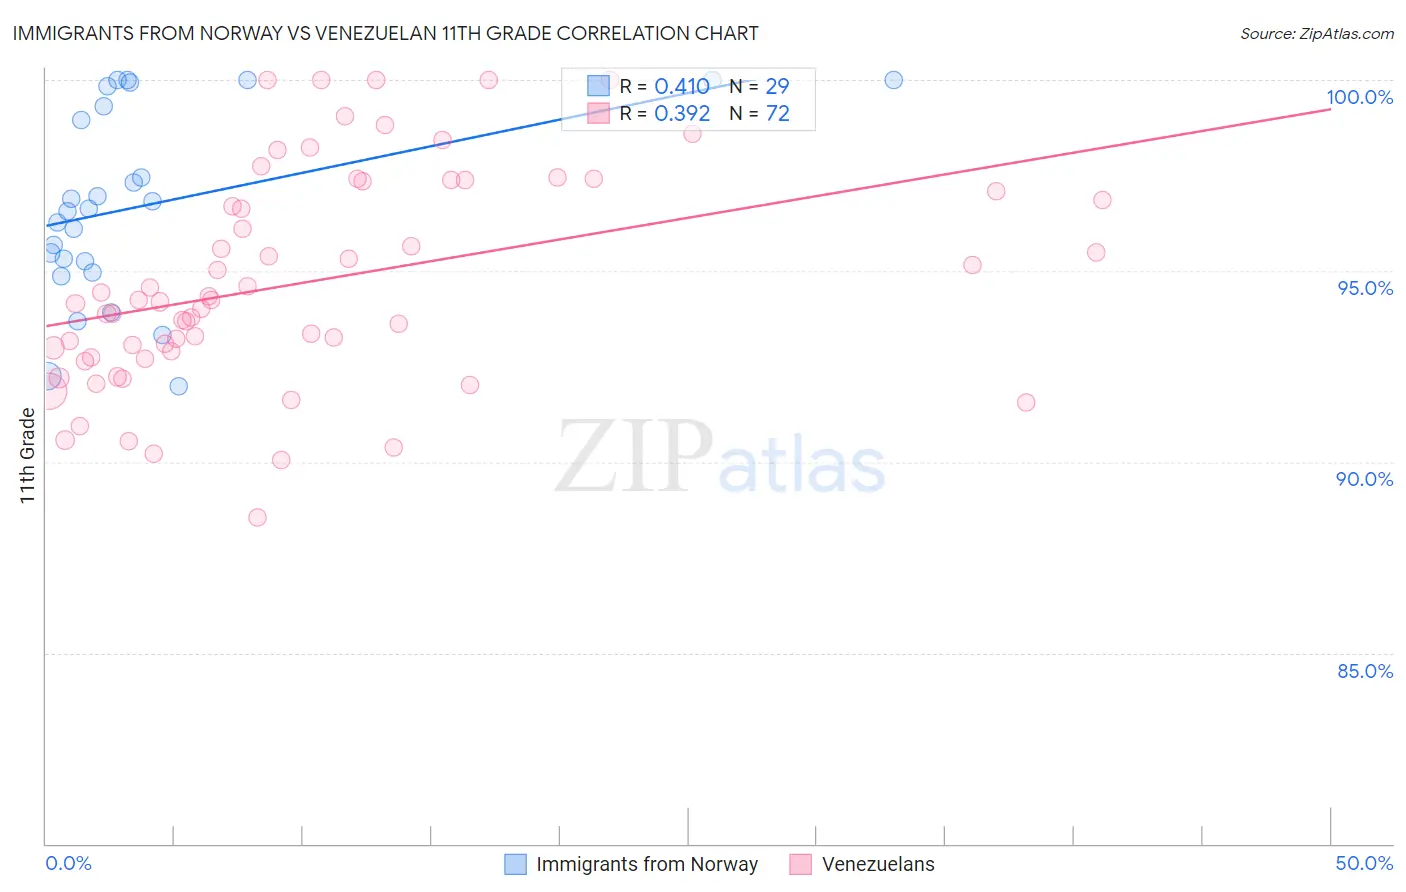
Immigrants from Norway vs Venezuelan 11th Grade Correlation Chart
The statistical analysis conducted on geographies consisting of 116,716,420 people shows a moderate positive correlation between the proportion of Immigrants from Norway and percentage of population with at least 11th grade education in the United States with a correlation coefficient (R) of 0.410 and weighted average of 93.5%. Similarly, the statistical analysis conducted on geographies consisting of 306,323,887 people shows a mild positive correlation between the proportion of Venezuelans and percentage of population with at least 11th grade education in the United States with a correlation coefficient (R) of 0.392 and weighted average of 92.9%, a difference of 0.62%.
11th Grade Correlation Summary
| Measurement | Immigrants from Norway | Venezuelan |
| Minimum | 92.0% | 88.5% |
| Maximum | 100.0% | 100.0% |
| Range | 8.0% | 11.5% |
| Mean | 96.8% | 94.7% |
| Median | 96.6% | 94.2% |
| Interquartile 25% (IQ1) | 95.1% | 92.8% |
| Interquartile 75% (IQ3) | 99.6% | 97.2% |
| Interquartile Range (IQR) | 4.5% | 4.4% |
| Standard Deviation (Sample) | 2.5% | 2.8% |
| Standard Deviation (Population) | 2.4% | 2.8% |
Similar Demographics by 11th Grade
Demographics Similar to Immigrants from Norway by 11th Grade
In terms of 11th grade, the demographic groups most similar to Immigrants from Norway are Alaska Native (93.5%, a difference of 0.0%), Immigrants from Kuwait (93.5%, a difference of 0.010%), Syrian (93.4%, a difference of 0.010%), Lebanese (93.5%, a difference of 0.020%), and Immigrants from Europe (93.5%, a difference of 0.020%).
| Demographics | Rating | Rank | 11th Grade |
| Immigrants | North Macedonia | 98.7 /100 | #100 | Exceptional 93.5% |
| Immigrants | Romania | 98.7 /100 | #101 | Exceptional 93.5% |
| Chippewa | 98.6 /100 | #102 | Exceptional 93.5% |
| Lebanese | 98.6 /100 | #103 | Exceptional 93.5% |
| Immigrants | Europe | 98.6 /100 | #104 | Exceptional 93.5% |
| Immigrants | Serbia | 98.6 /100 | #105 | Exceptional 93.5% |
| Immigrants | Croatia | 98.6 /100 | #106 | Exceptional 93.5% |
| Immigrants | Norway | 98.4 /100 | #107 | Exceptional 93.5% |
| Alaska Natives | 98.4 /100 | #108 | Exceptional 93.5% |
| Immigrants | Kuwait | 98.4 /100 | #109 | Exceptional 93.5% |
| Syrians | 98.4 /100 | #110 | Exceptional 93.4% |
| Yugoslavians | 98.1 /100 | #111 | Exceptional 93.4% |
| Immigrants | Germany | 98.0 /100 | #112 | Exceptional 93.4% |
| Immigrants | Zimbabwe | 97.8 /100 | #113 | Exceptional 93.4% |
| Jordanians | 97.8 /100 | #114 | Exceptional 93.4% |
Demographics Similar to Venezuelans by 11th Grade
In terms of 11th grade, the demographic groups most similar to Venezuelans are Crow (92.9%, a difference of 0.010%), Chilean (92.9%, a difference of 0.010%), Kenyan (92.9%, a difference of 0.020%), Immigrants from Brazil (92.9%, a difference of 0.030%), and Ugandan (92.9%, a difference of 0.030%).
| Demographics | Rating | Rank | 11th Grade |
| Mongolians | 87.6 /100 | #133 | Excellent 93.0% |
| Delaware | 87.3 /100 | #134 | Excellent 93.0% |
| Immigrants | Italy | 86.6 /100 | #135 | Excellent 92.9% |
| Cree | 85.9 /100 | #136 | Excellent 92.9% |
| Arabs | 85.4 /100 | #137 | Excellent 92.9% |
| Immigrants | Brazil | 85.1 /100 | #138 | Excellent 92.9% |
| Crow | 84.1 /100 | #139 | Excellent 92.9% |
| Venezuelans | 83.4 /100 | #140 | Excellent 92.9% |
| Chileans | 83.0 /100 | #141 | Excellent 92.9% |
| Kenyans | 82.0 /100 | #142 | Excellent 92.9% |
| Ugandans | 81.4 /100 | #143 | Excellent 92.9% |
| Assyrians/Chaldeans/Syriacs | 80.5 /100 | #144 | Excellent 92.8% |
| Pakistanis | 79.6 /100 | #145 | Good 92.8% |
| Iroquois | 79.1 /100 | #146 | Good 92.8% |
| Immigrants | Kenya | 78.7 /100 | #147 | Good 92.8% |