Immigrants from Northern Africa vs Marshallese Disability
COMPARE
Immigrants from Northern Africa
Marshallese
Disability
Disability Comparison
Immigrants from Northern Africa
Marshallese
10.9%
DISABILITY
99.7/ 100
METRIC RATING
62nd/ 347
METRIC RANK
13.1%
DISABILITY
0.0/ 100
METRIC RATING
293rd/ 347
METRIC RANK
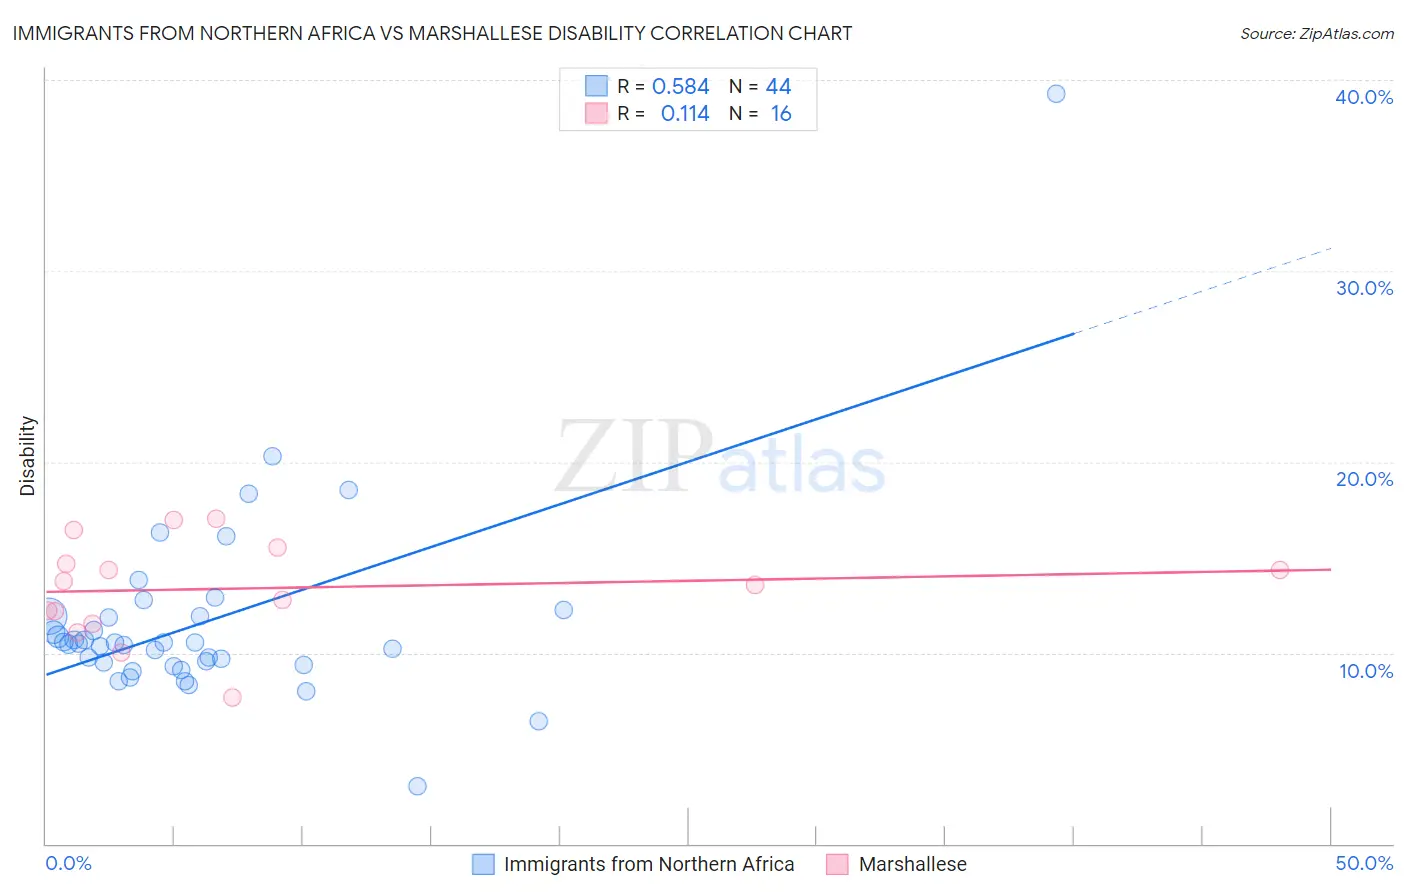
Immigrants from Northern Africa vs Marshallese Disability Correlation Chart
The statistical analysis conducted on geographies consisting of 321,190,304 people shows a substantial positive correlation between the proportion of Immigrants from Northern Africa and percentage of population with a disability in the United States with a correlation coefficient (R) of 0.584 and weighted average of 10.9%. Similarly, the statistical analysis conducted on geographies consisting of 14,761,315 people shows a poor positive correlation between the proportion of Marshallese and percentage of population with a disability in the United States with a correlation coefficient (R) of 0.114 and weighted average of 13.1%, a difference of 19.6%.
Disability Correlation Summary
| Measurement | Immigrants from Northern Africa | Marshallese |
| Minimum | 3.0% | 7.7% |
| Maximum | 39.3% | 17.0% |
| Range | 36.3% | 9.3% |
| Mean | 11.6% | 13.4% |
| Median | 10.5% | 13.7% |
| Interquartile 25% (IQ1) | 9.4% | 11.8% |
| Interquartile 75% (IQ3) | 11.9% | 15.1% |
| Interquartile Range (IQR) | 2.5% | 3.3% |
| Standard Deviation (Sample) | 5.3% | 2.6% |
| Standard Deviation (Population) | 5.2% | 2.5% |
Similar Demographics by Disability
Demographics Similar to Immigrants from Northern Africa by Disability
In terms of disability, the demographic groups most similar to Immigrants from Northern Africa are Immigrants from Eritrea (11.0%, a difference of 0.020%), Immigrants from Bulgaria (10.9%, a difference of 0.040%), Zimbabwean (10.9%, a difference of 0.10%), Immigrants from Colombia (10.9%, a difference of 0.19%), and Immigrants from Sweden (11.0%, a difference of 0.20%).
| Demographics | Rating | Rank | Disability |
| Immigrants | El Salvador | 99.8 /100 | #55 | Exceptional 10.9% |
| Immigrants | Lithuania | 99.8 /100 | #56 | Exceptional 10.9% |
| Salvadorans | 99.8 /100 | #57 | Exceptional 10.9% |
| Immigrants | South America | 99.8 /100 | #58 | Exceptional 10.9% |
| Immigrants | Colombia | 99.7 /100 | #59 | Exceptional 10.9% |
| Zimbabweans | 99.7 /100 | #60 | Exceptional 10.9% |
| Immigrants | Bulgaria | 99.7 /100 | #61 | Exceptional 10.9% |
| Immigrants | Northern Africa | 99.7 /100 | #62 | Exceptional 10.9% |
| Immigrants | Eritrea | 99.7 /100 | #63 | Exceptional 11.0% |
| Immigrants | Sweden | 99.6 /100 | #64 | Exceptional 11.0% |
| Bulgarians | 99.6 /100 | #65 | Exceptional 11.0% |
| Laotians | 99.6 /100 | #66 | Exceptional 11.0% |
| Colombians | 99.6 /100 | #67 | Exceptional 11.0% |
| Immigrants | Afghanistan | 99.6 /100 | #68 | Exceptional 11.0% |
| Sri Lankans | 99.5 /100 | #69 | Exceptional 11.0% |
Demographics Similar to Marshallese by Disability
In terms of disability, the demographic groups most similar to Marshallese are Aleut (13.1%, a difference of 0.0%), Celtic (13.1%, a difference of 0.29%), Yaqui (13.1%, a difference of 0.36%), Nonimmigrants (13.2%, a difference of 0.42%), and Central American Indian (13.2%, a difference of 0.46%).
| Demographics | Rating | Rank | Disability |
| English | 0.0 /100 | #286 | Tragic 13.0% |
| Africans | 0.0 /100 | #287 | Tragic 13.0% |
| Whites/Caucasians | 0.0 /100 | #288 | Tragic 13.0% |
| Slovaks | 0.0 /100 | #289 | Tragic 13.0% |
| Cheyenne | 0.0 /100 | #290 | Tragic 13.0% |
| Yaqui | 0.0 /100 | #291 | Tragic 13.1% |
| Aleuts | 0.0 /100 | #292 | Tragic 13.1% |
| Marshallese | 0.0 /100 | #293 | Tragic 13.1% |
| Celtics | 0.0 /100 | #294 | Tragic 13.1% |
| Immigrants | Nonimmigrants | 0.0 /100 | #295 | Tragic 13.2% |
| Central American Indians | 0.0 /100 | #296 | Tragic 13.2% |
| Hopi | 0.0 /100 | #297 | Tragic 13.2% |
| Alaska Natives | 0.0 /100 | #298 | Tragic 13.2% |
| French | 0.0 /100 | #299 | Tragic 13.2% |
| Pennsylvania Germans | 0.0 /100 | #300 | Tragic 13.2% |