Immigrants from Northern Africa vs Paraguayan Disability
COMPARE
Immigrants from Northern Africa
Paraguayan
Disability
Disability Comparison
Immigrants from Northern Africa
Paraguayans
10.9%
DISABILITY
99.7/ 100
METRIC RATING
62nd/ 347
METRIC RANK
10.6%
DISABILITY
100.0/ 100
METRIC RATING
32nd/ 347
METRIC RANK
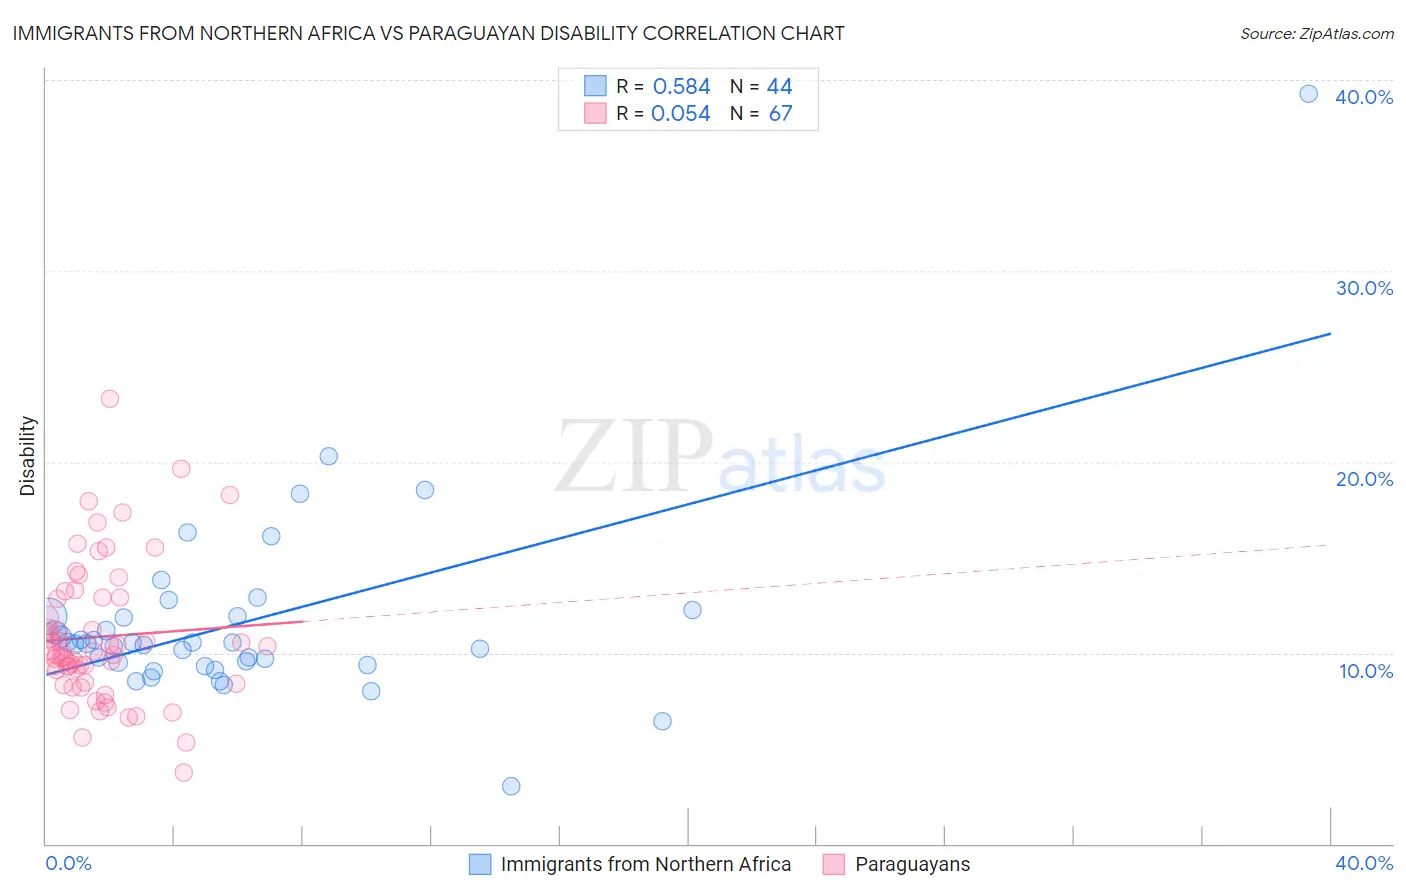
Immigrants from Northern Africa vs Paraguayan Disability Correlation Chart
The statistical analysis conducted on geographies consisting of 321,190,304 people shows a substantial positive correlation between the proportion of Immigrants from Northern Africa and percentage of population with a disability in the United States with a correlation coefficient (R) of 0.584 and weighted average of 10.9%. Similarly, the statistical analysis conducted on geographies consisting of 95,111,700 people shows a slight positive correlation between the proportion of Paraguayans and percentage of population with a disability in the United States with a correlation coefficient (R) of 0.054 and weighted average of 10.6%, a difference of 2.8%.
Disability Correlation Summary
| Measurement | Immigrants from Northern Africa | Paraguayan |
| Minimum | 3.0% | 3.7% |
| Maximum | 39.3% | 23.3% |
| Range | 36.3% | 19.6% |
| Mean | 11.6% | 10.8% |
| Median | 10.5% | 10.1% |
| Interquartile 25% (IQ1) | 9.4% | 8.5% |
| Interquartile 75% (IQ3) | 11.9% | 12.9% |
| Interquartile Range (IQR) | 2.5% | 4.4% |
| Standard Deviation (Sample) | 5.3% | 3.6% |
| Standard Deviation (Population) | 5.2% | 3.6% |
Similar Demographics by Disability
Demographics Similar to Immigrants from Northern Africa by Disability
In terms of disability, the demographic groups most similar to Immigrants from Northern Africa are Immigrants from Eritrea (11.0%, a difference of 0.020%), Immigrants from Bulgaria (10.9%, a difference of 0.040%), Zimbabwean (10.9%, a difference of 0.10%), Immigrants from Colombia (10.9%, a difference of 0.19%), and Immigrants from Sweden (11.0%, a difference of 0.20%).
| Demographics | Rating | Rank | Disability |
| Immigrants | El Salvador | 99.8 /100 | #55 | Exceptional 10.9% |
| Immigrants | Lithuania | 99.8 /100 | #56 | Exceptional 10.9% |
| Salvadorans | 99.8 /100 | #57 | Exceptional 10.9% |
| Immigrants | South America | 99.8 /100 | #58 | Exceptional 10.9% |
| Immigrants | Colombia | 99.7 /100 | #59 | Exceptional 10.9% |
| Zimbabweans | 99.7 /100 | #60 | Exceptional 10.9% |
| Immigrants | Bulgaria | 99.7 /100 | #61 | Exceptional 10.9% |
| Immigrants | Northern Africa | 99.7 /100 | #62 | Exceptional 10.9% |
| Immigrants | Eritrea | 99.7 /100 | #63 | Exceptional 11.0% |
| Immigrants | Sweden | 99.6 /100 | #64 | Exceptional 11.0% |
| Bulgarians | 99.6 /100 | #65 | Exceptional 11.0% |
| Laotians | 99.6 /100 | #66 | Exceptional 11.0% |
| Colombians | 99.6 /100 | #67 | Exceptional 11.0% |
| Immigrants | Afghanistan | 99.6 /100 | #68 | Exceptional 11.0% |
| Sri Lankans | 99.5 /100 | #69 | Exceptional 11.0% |
Demographics Similar to Paraguayans by Disability
In terms of disability, the demographic groups most similar to Paraguayans are Immigrants from Egypt (10.6%, a difference of 0.10%), Immigrants from Turkey (10.6%, a difference of 0.17%), Immigrants from Kuwait (10.7%, a difference of 0.25%), Immigrants from Argentina (10.6%, a difference of 0.33%), and Egyptian (10.6%, a difference of 0.46%).
| Demographics | Rating | Rank | Disability |
| Immigrants | Malaysia | 100.0 /100 | #25 | Exceptional 10.6% |
| Argentineans | 100.0 /100 | #26 | Exceptional 10.6% |
| Cypriots | 100.0 /100 | #27 | Exceptional 10.6% |
| Egyptians | 100.0 /100 | #28 | Exceptional 10.6% |
| Immigrants | Argentina | 100.0 /100 | #29 | Exceptional 10.6% |
| Immigrants | Turkey | 100.0 /100 | #30 | Exceptional 10.6% |
| Immigrants | Egypt | 100.0 /100 | #31 | Exceptional 10.6% |
| Paraguayans | 100.0 /100 | #32 | Exceptional 10.6% |
| Immigrants | Kuwait | 100.0 /100 | #33 | Exceptional 10.7% |
| Immigrants | Ethiopia | 100.0 /100 | #34 | Exceptional 10.7% |
| Immigrants | Indonesia | 100.0 /100 | #35 | Exceptional 10.7% |
| Ethiopians | 100.0 /100 | #36 | Exceptional 10.7% |
| Turks | 100.0 /100 | #37 | Exceptional 10.7% |
| Afghans | 99.9 /100 | #38 | Exceptional 10.8% |
| Cambodians | 99.9 /100 | #39 | Exceptional 10.8% |