Immigrants from North America vs Immigrants from Panama Disability
COMPARE
Immigrants from North America
Immigrants from Panama
Disability
Disability Comparison
Immigrants from North America
Immigrants from Panama
12.1%
DISABILITY
5.3/ 100
METRIC RATING
217th/ 347
METRIC RANK
11.9%
DISABILITY
14.6/ 100
METRIC RATING
199th/ 347
METRIC RANK
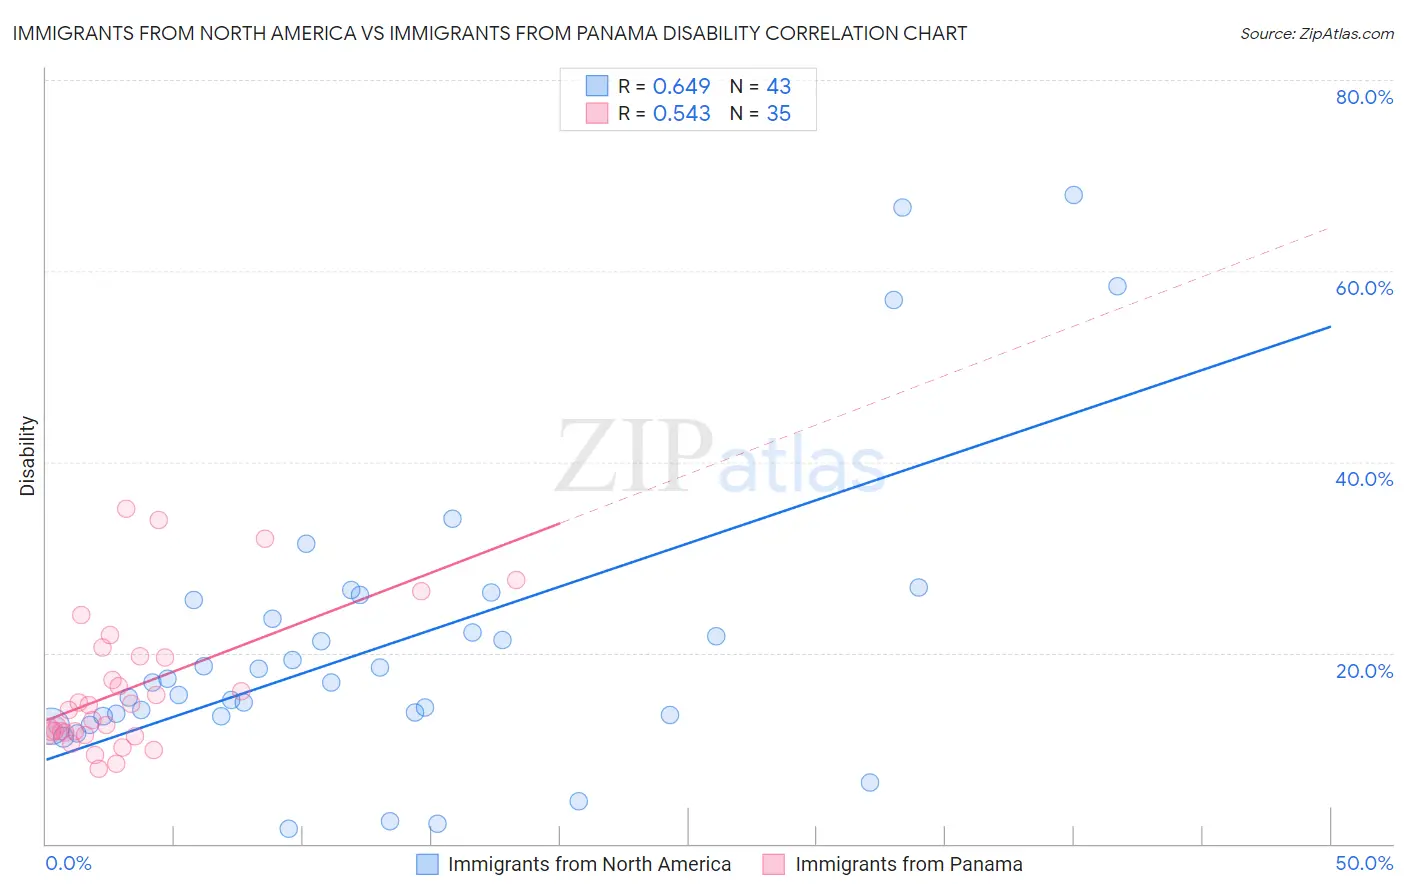
Immigrants from North America vs Immigrants from Panama Disability Correlation Chart
The statistical analysis conducted on geographies consisting of 462,438,985 people shows a significant positive correlation between the proportion of Immigrants from North America and percentage of population with a disability in the United States with a correlation coefficient (R) of 0.649 and weighted average of 12.1%. Similarly, the statistical analysis conducted on geographies consisting of 221,178,706 people shows a substantial positive correlation between the proportion of Immigrants from Panama and percentage of population with a disability in the United States with a correlation coefficient (R) of 0.543 and weighted average of 11.9%, a difference of 1.2%.
Disability Correlation Summary
| Measurement | Immigrants from North America | Immigrants from Panama |
| Minimum | 1.6% | 7.9% |
| Maximum | 68.0% | 35.1% |
| Range | 66.4% | 27.2% |
| Mean | 21.0% | 16.3% |
| Median | 16.9% | 14.0% |
| Interquartile 25% (IQ1) | 13.3% | 11.7% |
| Interquartile 75% (IQ3) | 25.6% | 19.7% |
| Interquartile Range (IQR) | 12.2% | 8.0% |
| Standard Deviation (Sample) | 15.3% | 7.3% |
| Standard Deviation (Population) | 15.2% | 7.2% |
Demographics Similar to Immigrants from North America and Immigrants from Panama by Disability
In terms of disability, the demographic groups most similar to Immigrants from North America are Panamanian (12.1%, a difference of 0.010%), Immigrants from Jamaica (12.1%, a difference of 0.060%), Immigrants from Canada (12.1%, a difference of 0.16%), Immigrants from Somalia (12.0%, a difference of 0.28%), and Immigrants from Iraq (12.0%, a difference of 0.33%). Similarly, the demographic groups most similar to Immigrants from Panama are Ukrainian (11.9%, a difference of 0.010%), Belizean (11.9%, a difference of 0.16%), Assyrian/Chaldean/Syriac (11.9%, a difference of 0.18%), Immigrants from England (12.0%, a difference of 0.25%), and British West Indian (12.0%, a difference of 0.30%).
| Demographics | Rating | Rank | Disability |
| Ukrainians | 14.7 /100 | #198 | Poor 11.9% |
| Immigrants | Panama | 14.6 /100 | #199 | Poor 11.9% |
| Belizeans | 12.8 /100 | #200 | Poor 11.9% |
| Assyrians/Chaldeans/Syriacs | 12.6 /100 | #201 | Poor 11.9% |
| Immigrants | England | 12.0 /100 | #202 | Poor 12.0% |
| British West Indians | 11.5 /100 | #203 | Poor 12.0% |
| Mexican American Indians | 11.4 /100 | #204 | Poor 12.0% |
| Immigrants | Western Europe | 10.1 /100 | #205 | Poor 12.0% |
| Immigrants | Senegal | 9.4 /100 | #206 | Tragic 12.0% |
| Immigrants | Thailand | 9.3 /100 | #207 | Tragic 12.0% |
| Immigrants | Caribbean | 9.1 /100 | #208 | Tragic 12.0% |
| Danes | 8.7 /100 | #209 | Tragic 12.0% |
| Czechs | 7.9 /100 | #210 | Tragic 12.0% |
| Immigrants | Cambodia | 7.3 /100 | #211 | Tragic 12.0% |
| Austrians | 7.2 /100 | #212 | Tragic 12.0% |
| Immigrants | Iraq | 7.1 /100 | #213 | Tragic 12.0% |
| Immigrants | Somalia | 6.8 /100 | #214 | Tragic 12.0% |
| Immigrants | Canada | 6.1 /100 | #215 | Tragic 12.1% |
| Panamanians | 5.4 /100 | #216 | Tragic 12.1% |
| Immigrants | North America | 5.3 /100 | #217 | Tragic 12.1% |
| Immigrants | Jamaica | 5.0 /100 | #218 | Tragic 12.1% |