Immigrants from Morocco vs Sierra Leonean Disability Age Over 75
COMPARE
Immigrants from Morocco
Sierra Leonean
Disability Age Over 75
Disability Age Over 75 Comparison
Immigrants from Morocco
Sierra Leoneans
47.1%
DISABILITY AGE OVER 75
71.4/ 100
METRIC RATING
159th/ 347
METRIC RANK
47.4%
DISABILITY AGE OVER 75
41.7/ 100
METRIC RATING
179th/ 347
METRIC RANK
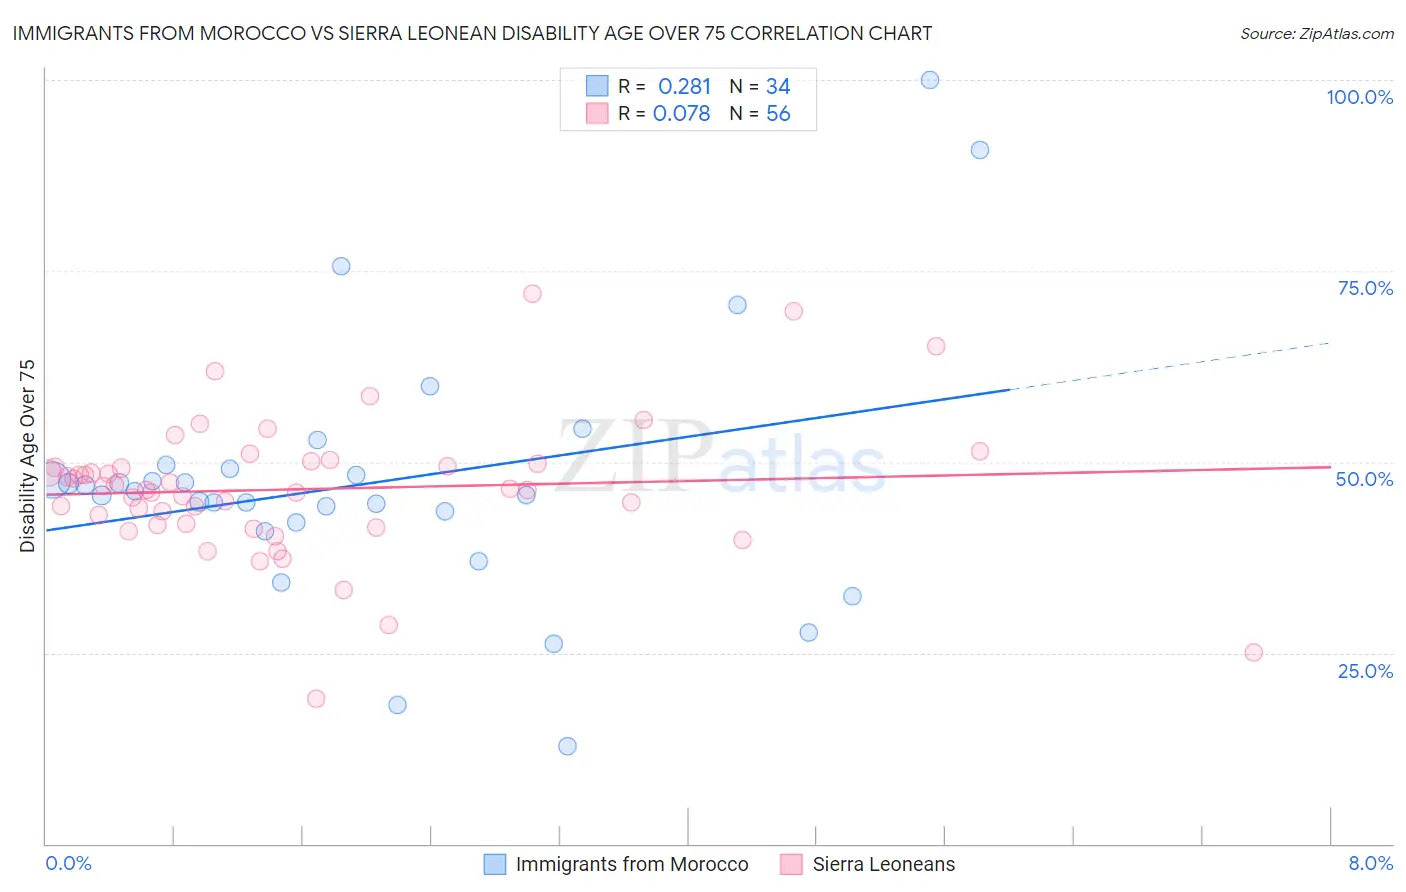
Immigrants from Morocco vs Sierra Leonean Disability Age Over 75 Correlation Chart
The statistical analysis conducted on geographies consisting of 178,881,213 people shows a weak positive correlation between the proportion of Immigrants from Morocco and percentage of population with a disability over the age of 75 in the United States with a correlation coefficient (R) of 0.281 and weighted average of 47.1%. Similarly, the statistical analysis conducted on geographies consisting of 83,299,730 people shows a slight positive correlation between the proportion of Sierra Leoneans and percentage of population with a disability over the age of 75 in the United States with a correlation coefficient (R) of 0.078 and weighted average of 47.4%, a difference of 0.70%.
Disability Age Over 75 Correlation Summary
| Measurement | Immigrants from Morocco | Sierra Leonean |
| Minimum | 12.8% | 19.0% |
| Maximum | 100.0% | 72.1% |
| Range | 87.2% | 53.1% |
| Mean | 47.3% | 46.4% |
| Median | 45.9% | 46.4% |
| Interquartile 25% (IQ1) | 42.1% | 41.8% |
| Interquartile 75% (IQ3) | 49.1% | 49.5% |
| Interquartile Range (IQR) | 7.0% | 7.7% |
| Standard Deviation (Sample) | 17.2% | 9.1% |
| Standard Deviation (Population) | 17.0% | 9.1% |
Demographics Similar to Immigrants from Morocco and Sierra Leoneans by Disability Age Over 75
In terms of disability age over 75, the demographic groups most similar to Immigrants from Morocco are Immigrants from Middle Africa (47.1%, a difference of 0.080%), South American Indian (47.1%, a difference of 0.090%), Pennsylvania German (47.2%, a difference of 0.14%), Immigrants from Eastern Africa (47.2%, a difference of 0.15%), and French (47.2%, a difference of 0.18%). Similarly, the demographic groups most similar to Sierra Leoneans are Cuban (47.4%, a difference of 0.010%), Haitian (47.4%, a difference of 0.070%), Ecuadorian (47.4%, a difference of 0.11%), Immigrants from Haiti (47.3%, a difference of 0.18%), and White/Caucasian (47.3%, a difference of 0.19%).
| Demographics | Rating | Rank | Disability Age Over 75 |
| Immigrants | Morocco | 71.4 /100 | #159 | Good 47.1% |
| Immigrants | Middle Africa | 68.3 /100 | #160 | Good 47.1% |
| South American Indians | 68.1 /100 | #161 | Good 47.1% |
| Pennsylvania Germans | 66.0 /100 | #162 | Good 47.2% |
| Immigrants | Eastern Africa | 65.5 /100 | #163 | Good 47.2% |
| French | 64.6 /100 | #164 | Good 47.2% |
| Immigrants | Zimbabwe | 64.4 /100 | #165 | Good 47.2% |
| Immigrants | Sierra Leone | 64.4 /100 | #166 | Good 47.2% |
| Moroccans | 62.9 /100 | #167 | Good 47.2% |
| Kenyans | 58.8 /100 | #168 | Average 47.2% |
| Celtics | 58.7 /100 | #169 | Average 47.2% |
| German Russians | 56.2 /100 | #170 | Average 47.3% |
| Immigrants | Africa | 53.6 /100 | #171 | Average 47.3% |
| Scotch-Irish | 52.5 /100 | #172 | Average 47.3% |
| Alsatians | 51.9 /100 | #173 | Average 47.3% |
| Whites/Caucasians | 50.0 /100 | #174 | Average 47.3% |
| Immigrants | Haiti | 49.7 /100 | #175 | Average 47.3% |
| Ecuadorians | 46.7 /100 | #176 | Average 47.4% |
| Haitians | 44.6 /100 | #177 | Average 47.4% |
| Cubans | 42.1 /100 | #178 | Average 47.4% |
| Sierra Leoneans | 41.7 /100 | #179 | Average 47.4% |