Immigrants from Morocco vs Cajun Disability Age Over 75
COMPARE
Immigrants from Morocco
Cajun
Disability Age Over 75
Disability Age Over 75 Comparison
Immigrants from Morocco
Cajuns
47.1%
DISABILITY AGE OVER 75
71.4/ 100
METRIC RATING
159th/ 347
METRIC RANK
50.7%
DISABILITY AGE OVER 75
0.0/ 100
METRIC RATING
311th/ 347
METRIC RANK
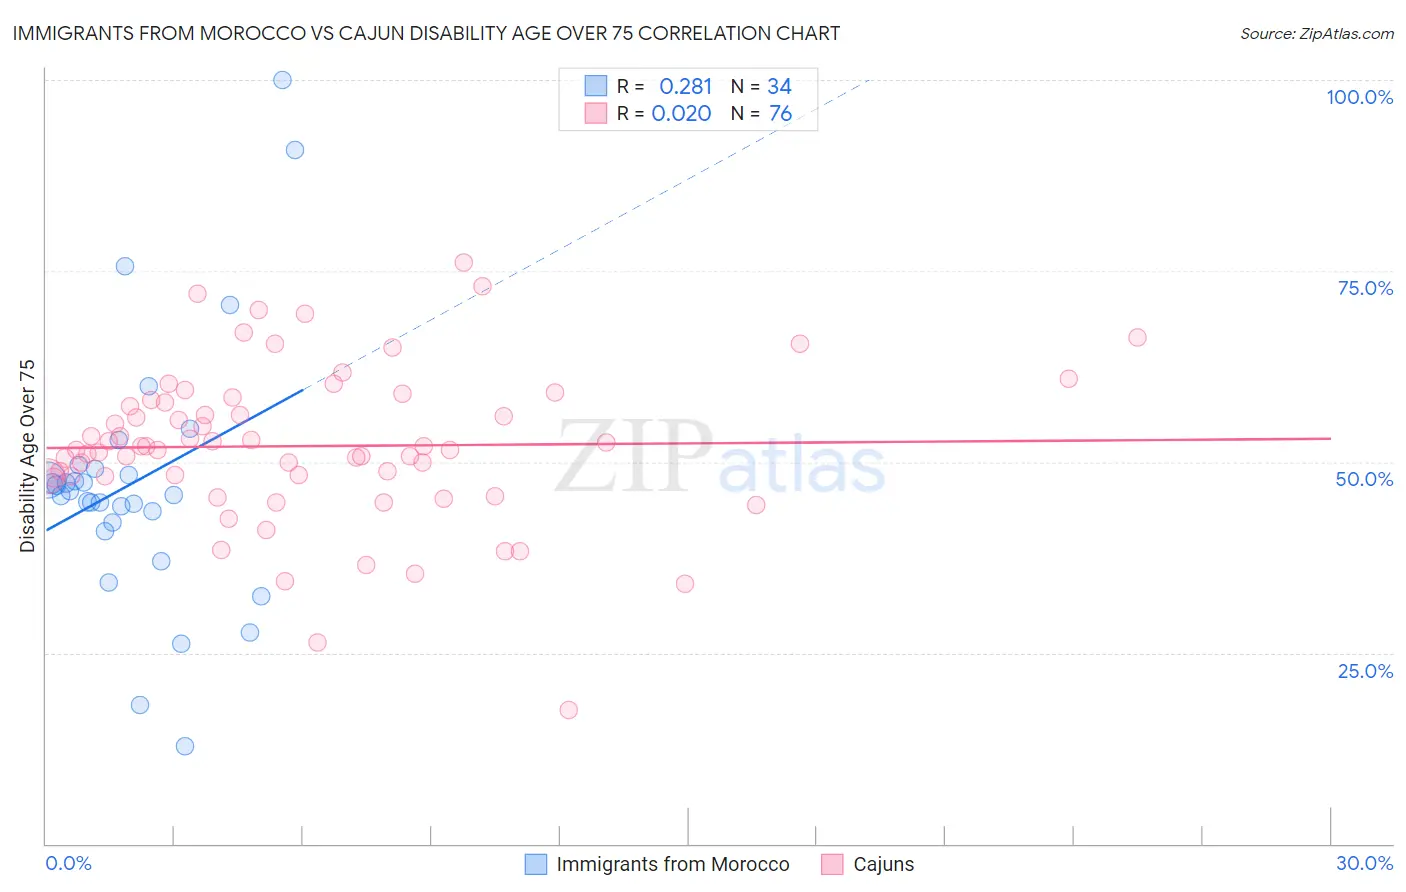
Immigrants from Morocco vs Cajun Disability Age Over 75 Correlation Chart
The statistical analysis conducted on geographies consisting of 178,881,213 people shows a weak positive correlation between the proportion of Immigrants from Morocco and percentage of population with a disability over the age of 75 in the United States with a correlation coefficient (R) of 0.281 and weighted average of 47.1%. Similarly, the statistical analysis conducted on geographies consisting of 149,580,177 people shows no correlation between the proportion of Cajuns and percentage of population with a disability over the age of 75 in the United States with a correlation coefficient (R) of 0.020 and weighted average of 50.7%, a difference of 7.5%.
Disability Age Over 75 Correlation Summary
| Measurement | Immigrants from Morocco | Cajun |
| Minimum | 12.8% | 17.5% |
| Maximum | 100.0% | 76.2% |
| Range | 87.2% | 58.7% |
| Mean | 47.3% | 52.1% |
| Median | 45.9% | 51.8% |
| Interquartile 25% (IQ1) | 42.1% | 48.1% |
| Interquartile 75% (IQ3) | 49.1% | 58.0% |
| Interquartile Range (IQR) | 7.0% | 9.9% |
| Standard Deviation (Sample) | 17.2% | 10.3% |
| Standard Deviation (Population) | 17.0% | 10.2% |
Similar Demographics by Disability Age Over 75
Demographics Similar to Immigrants from Morocco by Disability Age Over 75
In terms of disability age over 75, the demographic groups most similar to Immigrants from Morocco are Immigrants from Guyana (47.1%, a difference of 0.010%), Bhutanese (47.1%, a difference of 0.030%), Arab (47.1%, a difference of 0.050%), Immigrants from Middle Africa (47.1%, a difference of 0.080%), and Immigrants from Iran (47.1%, a difference of 0.090%).
| Demographics | Rating | Rank | Disability Age Over 75 |
| Immigrants | Asia | 76.5 /100 | #152 | Good 47.0% |
| Immigrants | Zaire | 74.8 /100 | #153 | Good 47.1% |
| Immigrants | Belarus | 74.8 /100 | #154 | Good 47.1% |
| Immigrants | Iran | 74.7 /100 | #155 | Good 47.1% |
| Arabs | 73.3 /100 | #156 | Good 47.1% |
| Bhutanese | 72.6 /100 | #157 | Good 47.1% |
| Immigrants | Guyana | 71.9 /100 | #158 | Good 47.1% |
| Immigrants | Morocco | 71.4 /100 | #159 | Good 47.1% |
| Immigrants | Middle Africa | 68.3 /100 | #160 | Good 47.1% |
| South American Indians | 68.1 /100 | #161 | Good 47.1% |
| Pennsylvania Germans | 66.0 /100 | #162 | Good 47.2% |
| Immigrants | Eastern Africa | 65.5 /100 | #163 | Good 47.2% |
| French | 64.6 /100 | #164 | Good 47.2% |
| Immigrants | Zimbabwe | 64.4 /100 | #165 | Good 47.2% |
| Immigrants | Sierra Leone | 64.4 /100 | #166 | Good 47.2% |
Demographics Similar to Cajuns by Disability Age Over 75
In terms of disability age over 75, the demographic groups most similar to Cajuns are Tlingit-Haida (50.6%, a difference of 0.10%), Hispanic or Latino (50.6%, a difference of 0.14%), Aleut (50.6%, a difference of 0.14%), Immigrants from Fiji (50.6%, a difference of 0.16%), and Immigrants from Central America (50.5%, a difference of 0.22%).
| Demographics | Rating | Rank | Disability Age Over 75 |
| Immigrants | Dominican Republic | 0.0 /100 | #304 | Tragic 50.3% |
| Central American Indians | 0.0 /100 | #305 | Tragic 50.5% |
| Immigrants | Central America | 0.0 /100 | #306 | Tragic 50.5% |
| Immigrants | Fiji | 0.0 /100 | #307 | Tragic 50.6% |
| Hispanics or Latinos | 0.0 /100 | #308 | Tragic 50.6% |
| Aleuts | 0.0 /100 | #309 | Tragic 50.6% |
| Tlingit-Haida | 0.0 /100 | #310 | Tragic 50.6% |
| Cajuns | 0.0 /100 | #311 | Tragic 50.7% |
| Cheyenne | 0.0 /100 | #312 | Tragic 50.9% |
| Immigrants | Azores | 0.0 /100 | #313 | Tragic 50.9% |
| Immigrants | Mexico | 0.0 /100 | #314 | Tragic 51.1% |
| Mexicans | 0.0 /100 | #315 | Tragic 51.1% |
| Chickasaw | 0.0 /100 | #316 | Tragic 51.2% |
| Yakama | 0.0 /100 | #317 | Tragic 51.3% |
| Seminole | 0.0 /100 | #318 | Tragic 51.5% |