Immigrants from Eastern Africa vs Sierra Leonean Disability Age Over 75
COMPARE
Immigrants from Eastern Africa
Sierra Leonean
Disability Age Over 75
Disability Age Over 75 Comparison
Immigrants from Eastern Africa
Sierra Leoneans
47.2%
DISABILITY AGE OVER 75
65.5/ 100
METRIC RATING
163rd/ 347
METRIC RANK
47.4%
DISABILITY AGE OVER 75
41.7/ 100
METRIC RATING
179th/ 347
METRIC RANK
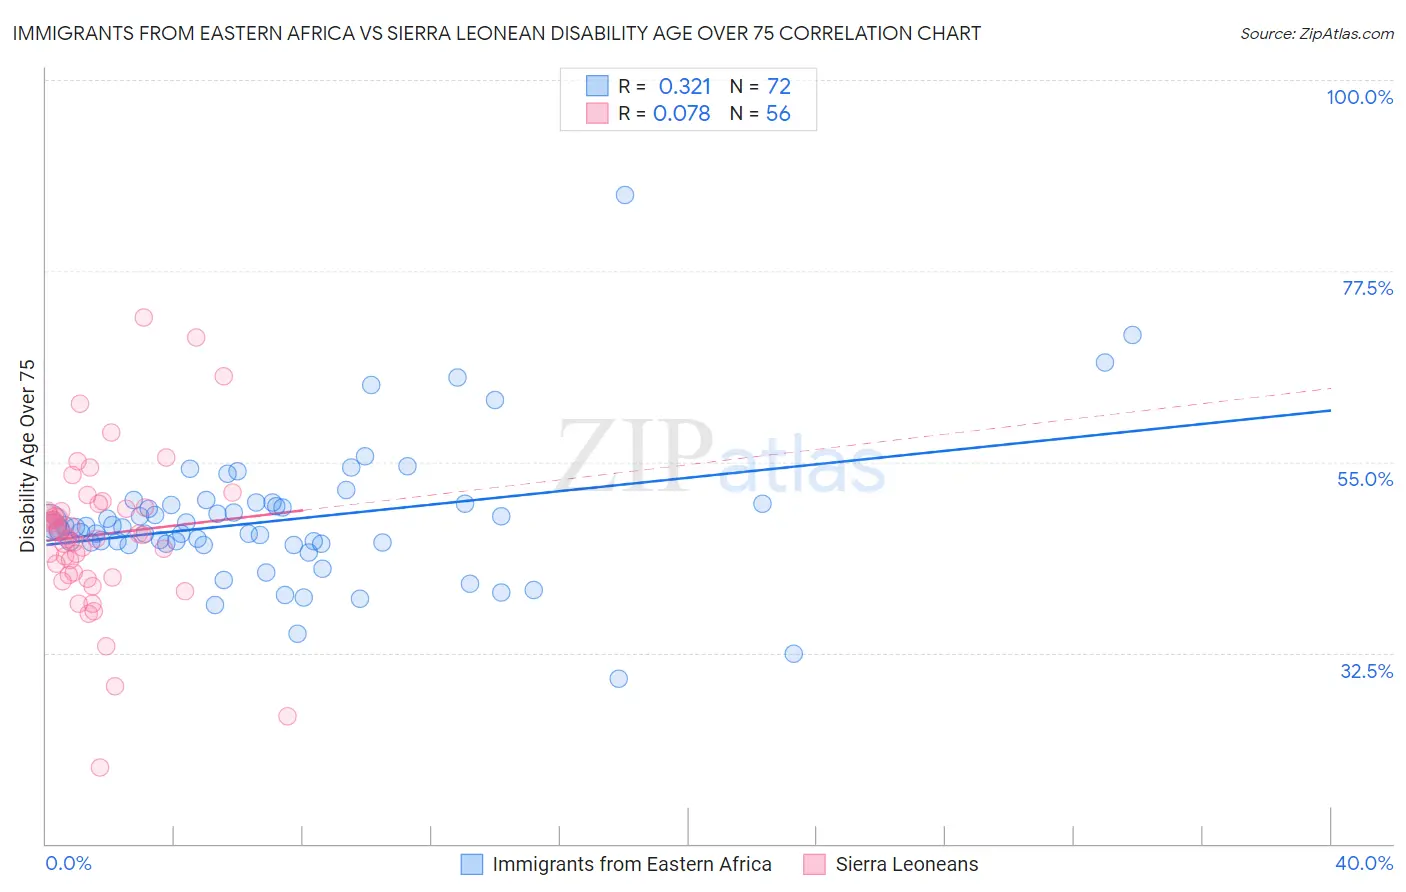
Immigrants from Eastern Africa vs Sierra Leonean Disability Age Over 75 Correlation Chart
The statistical analysis conducted on geographies consisting of 354,505,709 people shows a mild positive correlation between the proportion of Immigrants from Eastern Africa and percentage of population with a disability over the age of 75 in the United States with a correlation coefficient (R) of 0.321 and weighted average of 47.2%. Similarly, the statistical analysis conducted on geographies consisting of 83,299,730 people shows a slight positive correlation between the proportion of Sierra Leoneans and percentage of population with a disability over the age of 75 in the United States with a correlation coefficient (R) of 0.078 and weighted average of 47.4%, a difference of 0.55%.
Disability Age Over 75 Correlation Summary
| Measurement | Immigrants from Eastern Africa | Sierra Leonean |
| Minimum | 29.5% | 19.0% |
| Maximum | 86.5% | 72.1% |
| Range | 57.0% | 53.1% |
| Mean | 48.2% | 46.4% |
| Median | 47.2% | 46.4% |
| Interquartile 25% (IQ1) | 45.3% | 41.8% |
| Interquartile 75% (IQ3) | 50.0% | 49.5% |
| Interquartile Range (IQR) | 4.7% | 7.7% |
| Standard Deviation (Sample) | 8.3% | 9.1% |
| Standard Deviation (Population) | 8.2% | 9.1% |
Demographics Similar to Immigrants from Eastern Africa and Sierra Leoneans by Disability Age Over 75
In terms of disability age over 75, the demographic groups most similar to Immigrants from Eastern Africa are Pennsylvania German (47.2%, a difference of 0.010%), French (47.2%, a difference of 0.020%), Immigrants from Zimbabwe (47.2%, a difference of 0.030%), Immigrants from Sierra Leone (47.2%, a difference of 0.030%), and South American Indian (47.1%, a difference of 0.070%). Similarly, the demographic groups most similar to Sierra Leoneans are Immigrants from Ecuador (47.4%, a difference of 0.0%), Cuban (47.4%, a difference of 0.010%), Immigrants from Kazakhstan (47.4%, a difference of 0.030%), Haitian (47.4%, a difference of 0.070%), and Ecuadorian (47.4%, a difference of 0.11%).
| Demographics | Rating | Rank | Disability Age Over 75 |
| South American Indians | 68.1 /100 | #161 | Good 47.1% |
| Pennsylvania Germans | 66.0 /100 | #162 | Good 47.2% |
| Immigrants | Eastern Africa | 65.5 /100 | #163 | Good 47.2% |
| French | 64.6 /100 | #164 | Good 47.2% |
| Immigrants | Zimbabwe | 64.4 /100 | #165 | Good 47.2% |
| Immigrants | Sierra Leone | 64.4 /100 | #166 | Good 47.2% |
| Moroccans | 62.9 /100 | #167 | Good 47.2% |
| Kenyans | 58.8 /100 | #168 | Average 47.2% |
| Celtics | 58.7 /100 | #169 | Average 47.2% |
| German Russians | 56.2 /100 | #170 | Average 47.3% |
| Immigrants | Africa | 53.6 /100 | #171 | Average 47.3% |
| Scotch-Irish | 52.5 /100 | #172 | Average 47.3% |
| Alsatians | 51.9 /100 | #173 | Average 47.3% |
| Whites/Caucasians | 50.0 /100 | #174 | Average 47.3% |
| Immigrants | Haiti | 49.7 /100 | #175 | Average 47.3% |
| Ecuadorians | 46.7 /100 | #176 | Average 47.4% |
| Haitians | 44.6 /100 | #177 | Average 47.4% |
| Cubans | 42.1 /100 | #178 | Average 47.4% |
| Sierra Leoneans | 41.7 /100 | #179 | Average 47.4% |
| Immigrants | Ecuador | 41.7 /100 | #180 | Average 47.4% |
| Immigrants | Kazakhstan | 40.4 /100 | #181 | Average 47.4% |