Immigrants from Morocco vs Sierra Leonean Vision Disability
COMPARE
Immigrants from Morocco
Sierra Leonean
Vision Disability
Vision Disability Comparison
Immigrants from Morocco
Sierra Leoneans
2.1%
VISION DISABILITY
85.2/ 100
METRIC RATING
139th/ 347
METRIC RANK
2.1%
VISION DISABILITY
84.1/ 100
METRIC RATING
141st/ 347
METRIC RANK
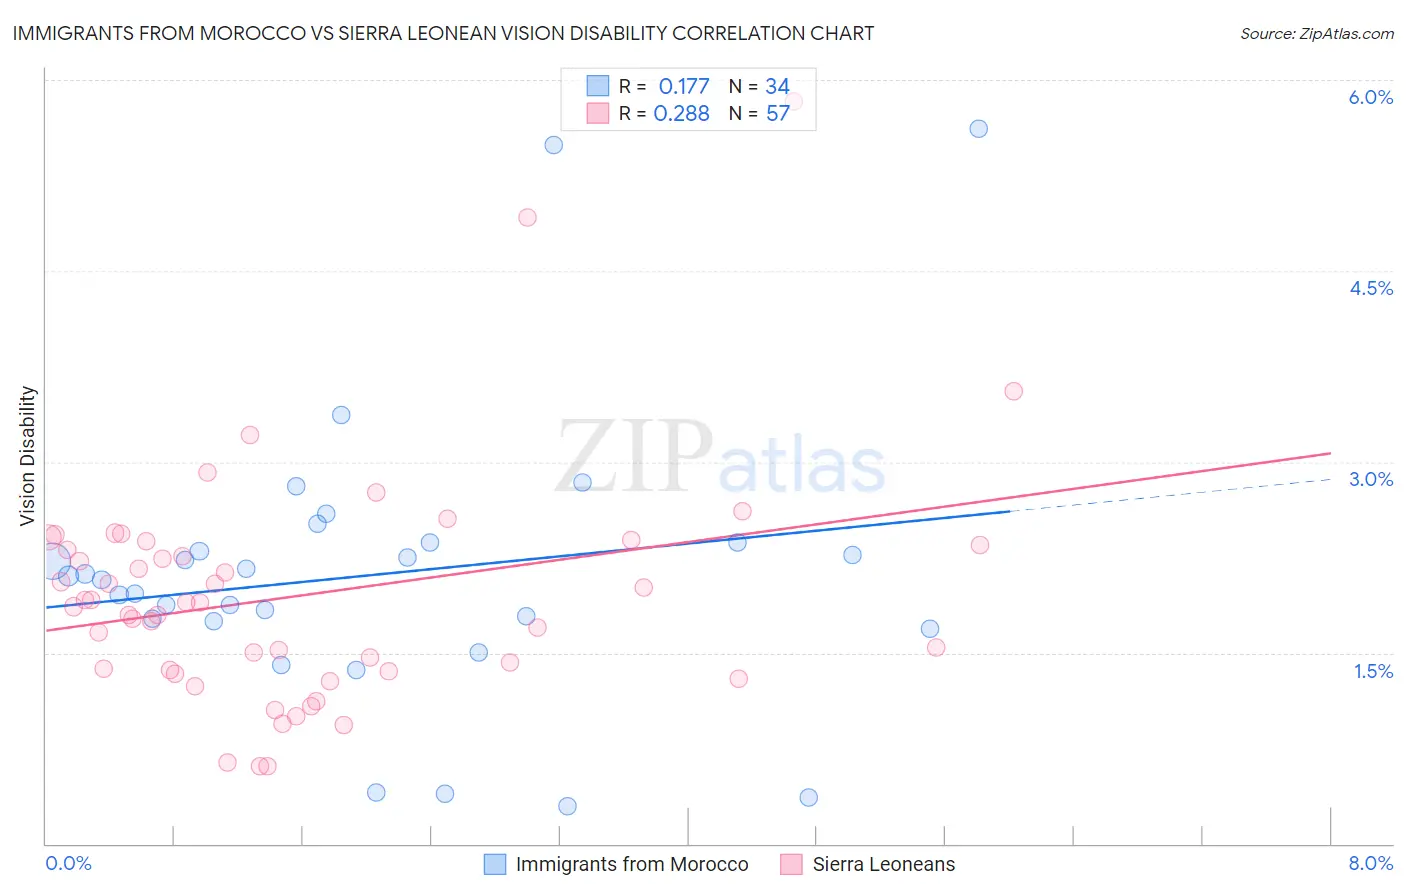
Immigrants from Morocco vs Sierra Leonean Vision Disability Correlation Chart
The statistical analysis conducted on geographies consisting of 178,891,599 people shows a poor positive correlation between the proportion of Immigrants from Morocco and percentage of population with vision disability in the United States with a correlation coefficient (R) of 0.177 and weighted average of 2.1%. Similarly, the statistical analysis conducted on geographies consisting of 83,336,736 people shows a weak positive correlation between the proportion of Sierra Leoneans and percentage of population with vision disability in the United States with a correlation coefficient (R) of 0.288 and weighted average of 2.1%, a difference of 0.13%.
Vision Disability Correlation Summary
| Measurement | Immigrants from Morocco | Sierra Leonean |
| Minimum | 0.29% | 0.61% |
| Maximum | 5.6% | 5.8% |
| Range | 5.3% | 5.2% |
| Mean | 2.1% | 2.0% |
| Median | 2.1% | 1.9% |
| Interquartile 25% (IQ1) | 1.8% | 1.4% |
| Interquartile 75% (IQ3) | 2.4% | 2.4% |
| Interquartile Range (IQR) | 0.61% | 1.0% |
| Standard Deviation (Sample) | 1.1% | 0.92% |
| Standard Deviation (Population) | 1.1% | 0.91% |
Demographics Similar to Immigrants from Morocco and Sierra Leoneans by Vision Disability
In terms of vision disability, the demographic groups most similar to Immigrants from Morocco are Immigrants from Netherlands (2.1%, a difference of 0.13%), Arab (2.1%, a difference of 0.14%), Czech (2.1%, a difference of 0.15%), Immigrants from South Eastern Asia (2.1%, a difference of 0.15%), and Vietnamese (2.1%, a difference of 0.20%). Similarly, the demographic groups most similar to Sierra Leoneans are Immigrants from Netherlands (2.1%, a difference of 0.010%), South American (2.1%, a difference of 0.15%), Immigrants from Sierra Leone (2.1%, a difference of 0.15%), Ukrainian (2.1%, a difference of 0.25%), and Arab (2.1%, a difference of 0.28%).
| Demographics | Rating | Rank | Vision Disability |
| Immigrants | Kenya | 88.7 /100 | #130 | Excellent 2.1% |
| Immigrants | Hungary | 88.7 /100 | #131 | Excellent 2.1% |
| New Zealanders | 88.2 /100 | #132 | Excellent 2.1% |
| Syrians | 87.5 /100 | #133 | Excellent 2.1% |
| Venezuelans | 87.2 /100 | #134 | Excellent 2.1% |
| Vietnamese | 86.7 /100 | #135 | Excellent 2.1% |
| Czechs | 86.3 /100 | #136 | Excellent 2.1% |
| Immigrants | South Eastern Asia | 86.3 /100 | #137 | Excellent 2.1% |
| Arabs | 86.3 /100 | #138 | Excellent 2.1% |
| Immigrants | Morocco | 85.2 /100 | #139 | Excellent 2.1% |
| Immigrants | Netherlands | 84.2 /100 | #140 | Excellent 2.1% |
| Sierra Leoneans | 84.1 /100 | #141 | Excellent 2.1% |
| South Americans | 82.8 /100 | #142 | Excellent 2.1% |
| Immigrants | Sierra Leone | 82.8 /100 | #143 | Excellent 2.1% |
| Ukrainians | 81.9 /100 | #144 | Excellent 2.1% |
| Immigrants | Bosnia and Herzegovina | 81.5 /100 | #145 | Excellent 2.1% |
| Italians | 79.7 /100 | #146 | Good 2.1% |
| Immigrants | Sudan | 78.4 /100 | #147 | Good 2.1% |
| Finns | 78.3 /100 | #148 | Good 2.1% |
| Colombians | 76.2 /100 | #149 | Good 2.1% |
| Belgians | 75.9 /100 | #150 | Good 2.1% |