Immigrants from Fiji vs Sierra Leonean Disability Age Over 75
COMPARE
Immigrants from Fiji
Sierra Leonean
Disability Age Over 75
Disability Age Over 75 Comparison
Immigrants from Fiji
Sierra Leoneans
50.6%
DISABILITY AGE OVER 75
0.0/ 100
METRIC RATING
307th/ 347
METRIC RANK
47.4%
DISABILITY AGE OVER 75
41.7/ 100
METRIC RATING
179th/ 347
METRIC RANK
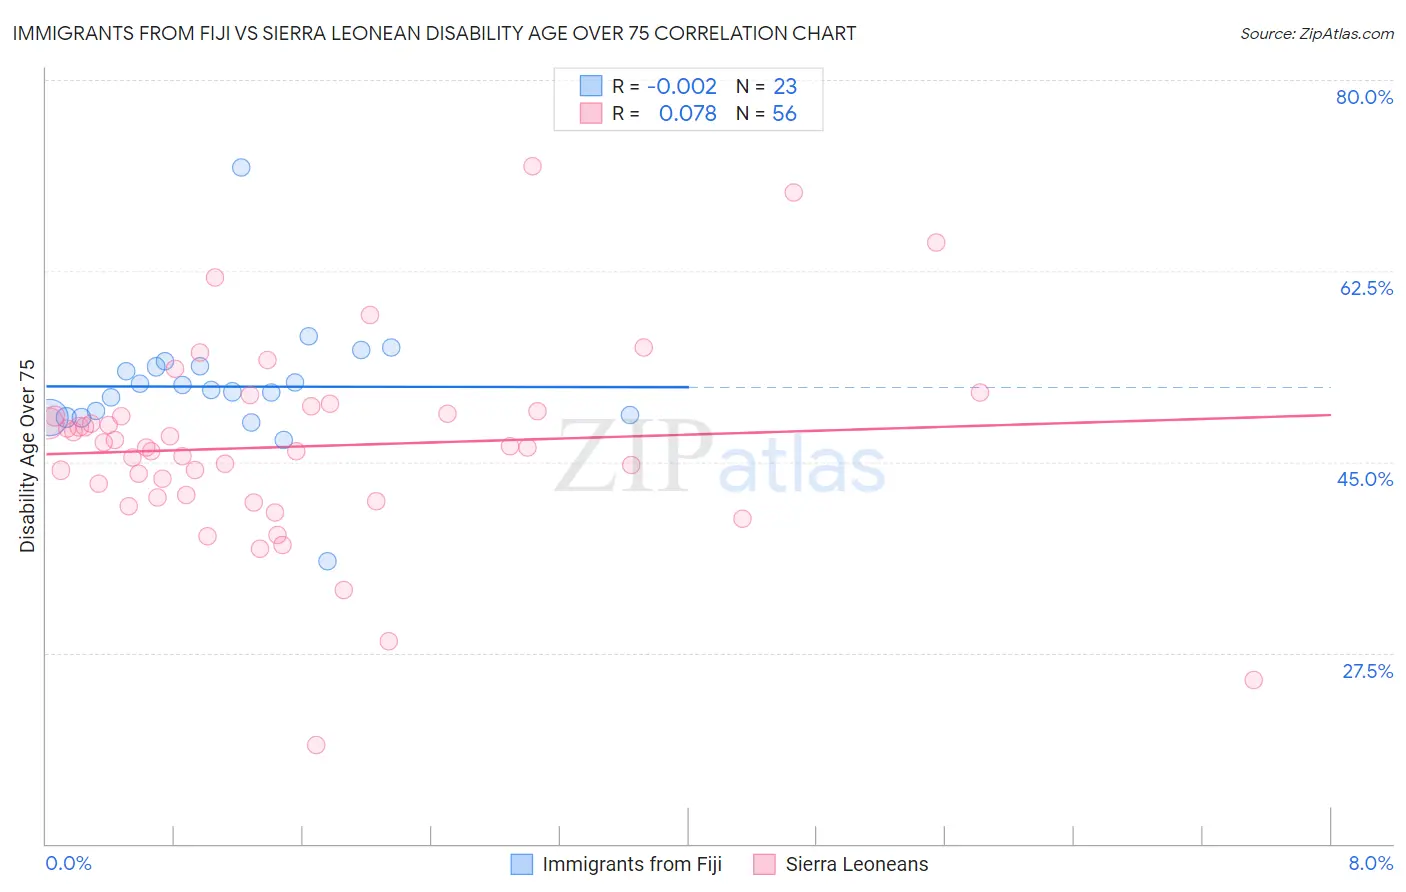
Immigrants from Fiji vs Sierra Leonean Disability Age Over 75 Correlation Chart
The statistical analysis conducted on geographies consisting of 93,724,522 people shows no correlation between the proportion of Immigrants from Fiji and percentage of population with a disability over the age of 75 in the United States with a correlation coefficient (R) of -0.002 and weighted average of 50.6%. Similarly, the statistical analysis conducted on geographies consisting of 83,299,730 people shows a slight positive correlation between the proportion of Sierra Leoneans and percentage of population with a disability over the age of 75 in the United States with a correlation coefficient (R) of 0.078 and weighted average of 47.4%, a difference of 6.6%.
Disability Age Over 75 Correlation Summary
| Measurement | Immigrants from Fiji | Sierra Leonean |
| Minimum | 35.9% | 19.0% |
| Maximum | 72.0% | 72.1% |
| Range | 36.1% | 53.1% |
| Mean | 51.9% | 46.4% |
| Median | 51.5% | 46.4% |
| Interquartile 25% (IQ1) | 49.1% | 41.8% |
| Interquartile 75% (IQ3) | 53.8% | 49.5% |
| Interquartile Range (IQR) | 4.7% | 7.7% |
| Standard Deviation (Sample) | 6.0% | 9.1% |
| Standard Deviation (Population) | 5.9% | 9.1% |
Similar Demographics by Disability Age Over 75
Demographics Similar to Immigrants from Fiji by Disability Age Over 75
In terms of disability age over 75, the demographic groups most similar to Immigrants from Fiji are Hispanic or Latino (50.6%, a difference of 0.020%), Aleut (50.6%, a difference of 0.030%), Immigrants from Central America (50.5%, a difference of 0.060%), Tlingit-Haida (50.6%, a difference of 0.070%), and Central American Indian (50.5%, a difference of 0.15%).
| Demographics | Rating | Rank | Disability Age Over 75 |
| Cape Verdeans | 0.0 /100 | #300 | Tragic 50.1% |
| Dominicans | 0.0 /100 | #301 | Tragic 50.2% |
| Cherokee | 0.0 /100 | #302 | Tragic 50.2% |
| Japanese | 0.0 /100 | #303 | Tragic 50.2% |
| Immigrants | Dominican Republic | 0.0 /100 | #304 | Tragic 50.3% |
| Central American Indians | 0.0 /100 | #305 | Tragic 50.5% |
| Immigrants | Central America | 0.0 /100 | #306 | Tragic 50.5% |
| Immigrants | Fiji | 0.0 /100 | #307 | Tragic 50.6% |
| Hispanics or Latinos | 0.0 /100 | #308 | Tragic 50.6% |
| Aleuts | 0.0 /100 | #309 | Tragic 50.6% |
| Tlingit-Haida | 0.0 /100 | #310 | Tragic 50.6% |
| Cajuns | 0.0 /100 | #311 | Tragic 50.7% |
| Cheyenne | 0.0 /100 | #312 | Tragic 50.9% |
| Immigrants | Azores | 0.0 /100 | #313 | Tragic 50.9% |
| Immigrants | Mexico | 0.0 /100 | #314 | Tragic 51.1% |
Demographics Similar to Sierra Leoneans by Disability Age Over 75
In terms of disability age over 75, the demographic groups most similar to Sierra Leoneans are Immigrants from Ecuador (47.4%, a difference of 0.0%), Cuban (47.4%, a difference of 0.010%), Immigrants from Kazakhstan (47.4%, a difference of 0.030%), Immigrants from Moldova (47.4%, a difference of 0.040%), and Delaware (47.5%, a difference of 0.060%).
| Demographics | Rating | Rank | Disability Age Over 75 |
| Scotch-Irish | 52.5 /100 | #172 | Average 47.3% |
| Alsatians | 51.9 /100 | #173 | Average 47.3% |
| Whites/Caucasians | 50.0 /100 | #174 | Average 47.3% |
| Immigrants | Haiti | 49.7 /100 | #175 | Average 47.3% |
| Ecuadorians | 46.7 /100 | #176 | Average 47.4% |
| Haitians | 44.6 /100 | #177 | Average 47.4% |
| Cubans | 42.1 /100 | #178 | Average 47.4% |
| Sierra Leoneans | 41.7 /100 | #179 | Average 47.4% |
| Immigrants | Ecuador | 41.7 /100 | #180 | Average 47.4% |
| Immigrants | Kazakhstan | 40.4 /100 | #181 | Average 47.4% |
| Immigrants | Moldova | 39.9 /100 | #182 | Fair 47.4% |
| Delaware | 39.1 /100 | #183 | Fair 47.5% |
| Immigrants | Nigeria | 34.0 /100 | #184 | Fair 47.5% |
| Ghanaians | 33.0 /100 | #185 | Fair 47.5% |
| Sudanese | 32.0 /100 | #186 | Fair 47.5% |