Immigrants from Moldova vs German Russian Disability Age Over 75
COMPARE
Immigrants from Moldova
German Russian
Disability Age Over 75
Disability Age Over 75 Comparison
Immigrants from Moldova
German Russians
47.4%
DISABILITY AGE OVER 75
39.9/ 100
METRIC RATING
182nd/ 347
METRIC RANK
47.3%
DISABILITY AGE OVER 75
56.2/ 100
METRIC RATING
170th/ 347
METRIC RANK
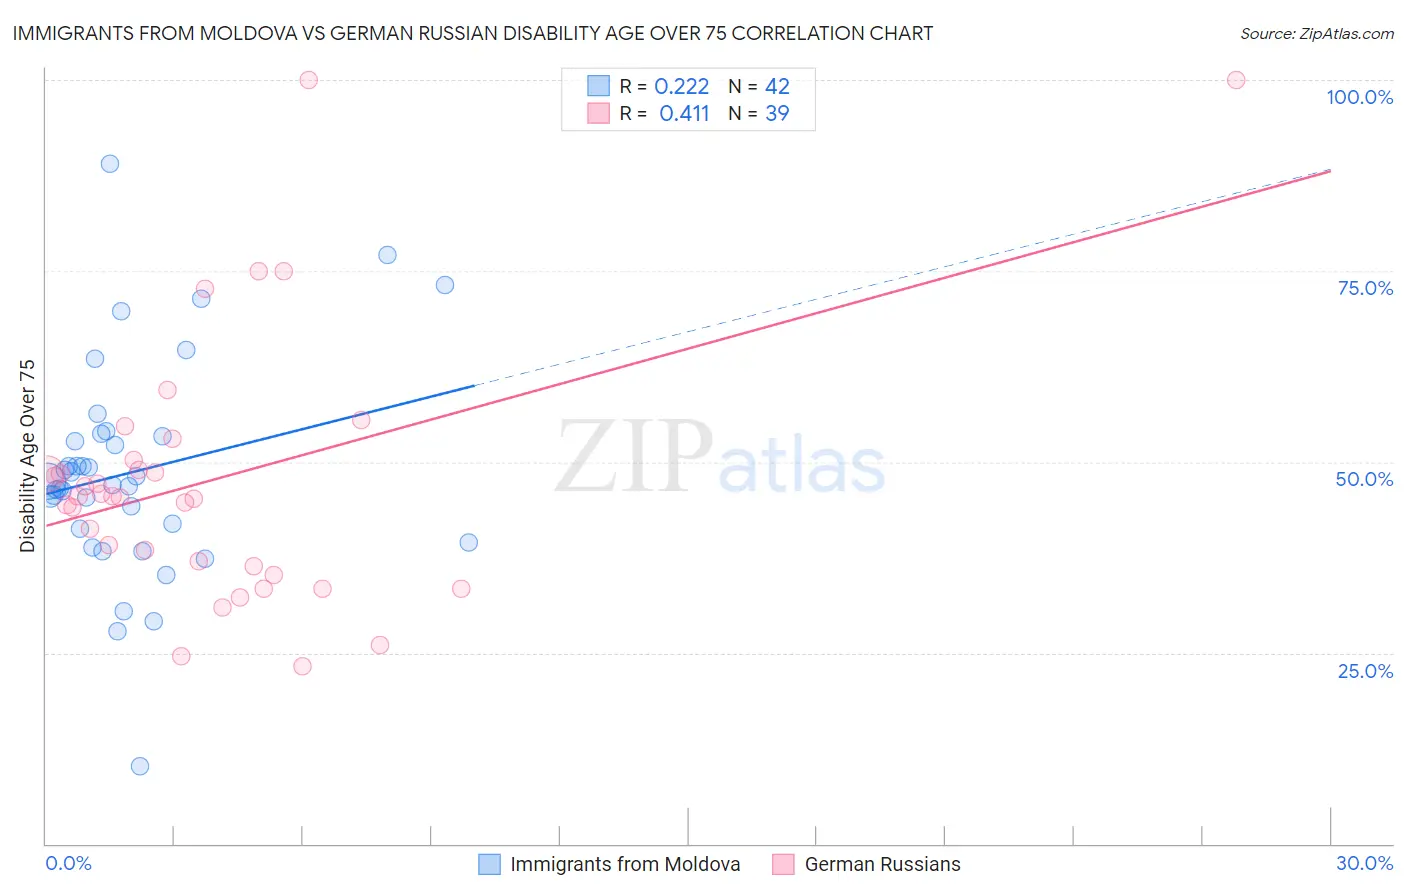
Immigrants from Moldova vs German Russian Disability Age Over 75 Correlation Chart
The statistical analysis conducted on geographies consisting of 124,351,560 people shows a weak positive correlation between the proportion of Immigrants from Moldova and percentage of population with a disability over the age of 75 in the United States with a correlation coefficient (R) of 0.222 and weighted average of 47.4%. Similarly, the statistical analysis conducted on geographies consisting of 96,358,240 people shows a moderate positive correlation between the proportion of German Russians and percentage of population with a disability over the age of 75 in the United States with a correlation coefficient (R) of 0.411 and weighted average of 47.3%, a difference of 0.37%.
Disability Age Over 75 Correlation Summary
| Measurement | Immigrants from Moldova | German Russian |
| Minimum | 10.1% | 23.2% |
| Maximum | 89.0% | 100.0% |
| Range | 78.9% | 76.8% |
| Mean | 48.6% | 47.6% |
| Median | 47.2% | 45.4% |
| Interquartile 25% (IQ1) | 41.3% | 36.4% |
| Interquartile 75% (IQ3) | 53.4% | 50.2% |
| Interquartile Range (IQR) | 12.1% | 13.8% |
| Standard Deviation (Sample) | 14.1% | 17.2% |
| Standard Deviation (Population) | 13.9% | 17.0% |
Demographics Similar to Immigrants from Moldova and German Russians by Disability Age Over 75
In terms of disability age over 75, the demographic groups most similar to Immigrants from Moldova are Immigrants from Kazakhstan (47.4%, a difference of 0.010%), Delaware (47.5%, a difference of 0.020%), Sierra Leonean (47.4%, a difference of 0.040%), Immigrants from Ecuador (47.4%, a difference of 0.040%), and Cuban (47.4%, a difference of 0.050%). Similarly, the demographic groups most similar to German Russians are Kenyan (47.2%, a difference of 0.060%), Celtic (47.2%, a difference of 0.060%), Immigrants from Africa (47.3%, a difference of 0.060%), Scotch-Irish (47.3%, a difference of 0.080%), and Alsatian (47.3%, a difference of 0.10%).
| Demographics | Rating | Rank | Disability Age Over 75 |
| Immigrants | Sierra Leone | 64.4 /100 | #166 | Good 47.2% |
| Moroccans | 62.9 /100 | #167 | Good 47.2% |
| Kenyans | 58.8 /100 | #168 | Average 47.2% |
| Celtics | 58.7 /100 | #169 | Average 47.2% |
| German Russians | 56.2 /100 | #170 | Average 47.3% |
| Immigrants | Africa | 53.6 /100 | #171 | Average 47.3% |
| Scotch-Irish | 52.5 /100 | #172 | Average 47.3% |
| Alsatians | 51.9 /100 | #173 | Average 47.3% |
| Whites/Caucasians | 50.0 /100 | #174 | Average 47.3% |
| Immigrants | Haiti | 49.7 /100 | #175 | Average 47.3% |
| Ecuadorians | 46.7 /100 | #176 | Average 47.4% |
| Haitians | 44.6 /100 | #177 | Average 47.4% |
| Cubans | 42.1 /100 | #178 | Average 47.4% |
| Sierra Leoneans | 41.7 /100 | #179 | Average 47.4% |
| Immigrants | Ecuador | 41.7 /100 | #180 | Average 47.4% |
| Immigrants | Kazakhstan | 40.4 /100 | #181 | Average 47.4% |
| Immigrants | Moldova | 39.9 /100 | #182 | Fair 47.4% |
| Delaware | 39.1 /100 | #183 | Fair 47.5% |
| Immigrants | Nigeria | 34.0 /100 | #184 | Fair 47.5% |
| Ghanaians | 33.0 /100 | #185 | Fair 47.5% |
| Sudanese | 32.0 /100 | #186 | Fair 47.5% |