Immigrants from Moldova vs Immigrants from Caribbean Disability Age Over 75
COMPARE
Immigrants from Moldova
Immigrants from Caribbean
Disability Age Over 75
Disability Age Over 75 Comparison
Immigrants from Moldova
Immigrants from Caribbean
47.4%
DISABILITY AGE OVER 75
39.9/ 100
METRIC RATING
182nd/ 347
METRIC RANK
48.4%
DISABILITY AGE OVER 75
2.1/ 100
METRIC RATING
243rd/ 347
METRIC RANK
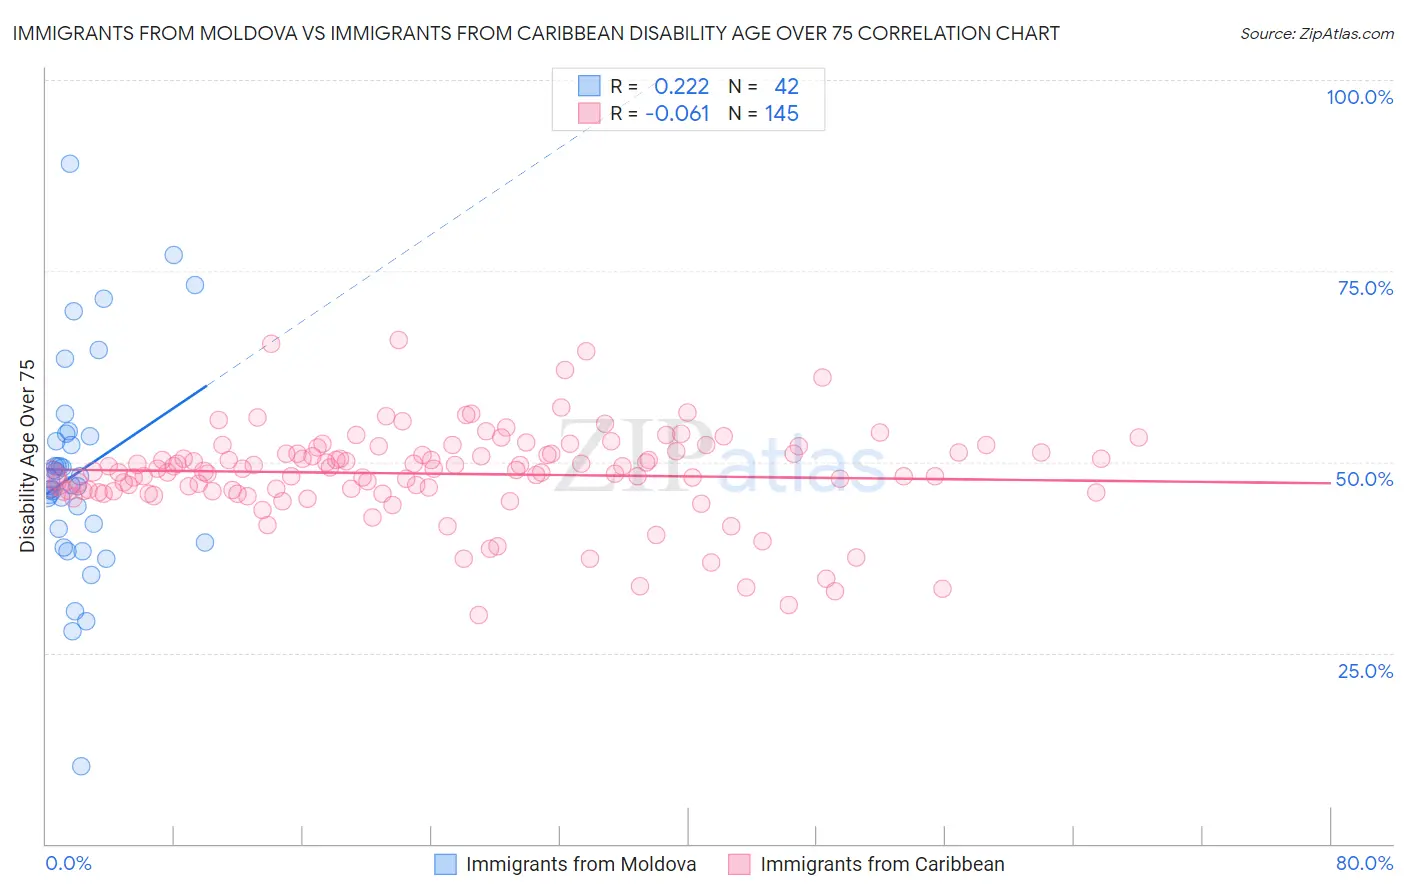
Immigrants from Moldova vs Immigrants from Caribbean Disability Age Over 75 Correlation Chart
The statistical analysis conducted on geographies consisting of 124,351,560 people shows a weak positive correlation between the proportion of Immigrants from Moldova and percentage of population with a disability over the age of 75 in the United States with a correlation coefficient (R) of 0.222 and weighted average of 47.4%. Similarly, the statistical analysis conducted on geographies consisting of 448,909,914 people shows a slight negative correlation between the proportion of Immigrants from Caribbean and percentage of population with a disability over the age of 75 in the United States with a correlation coefficient (R) of -0.061 and weighted average of 48.4%, a difference of 1.9%.
Disability Age Over 75 Correlation Summary
| Measurement | Immigrants from Moldova | Immigrants from Caribbean |
| Minimum | 10.1% | 30.0% |
| Maximum | 89.0% | 66.0% |
| Range | 78.9% | 36.0% |
| Mean | 48.6% | 48.4% |
| Median | 47.2% | 48.9% |
| Interquartile 25% (IQ1) | 41.3% | 46.2% |
| Interquartile 75% (IQ3) | 53.4% | 51.3% |
| Interquartile Range (IQR) | 12.1% | 5.1% |
| Standard Deviation (Sample) | 14.1% | 6.0% |
| Standard Deviation (Population) | 13.9% | 6.0% |
Similar Demographics by Disability Age Over 75
Demographics Similar to Immigrants from Moldova by Disability Age Over 75
In terms of disability age over 75, the demographic groups most similar to Immigrants from Moldova are Immigrants from Kazakhstan (47.4%, a difference of 0.010%), Delaware (47.5%, a difference of 0.020%), Sierra Leonean (47.4%, a difference of 0.040%), Immigrants from Ecuador (47.4%, a difference of 0.040%), and Cuban (47.4%, a difference of 0.050%).
| Demographics | Rating | Rank | Disability Age Over 75 |
| Immigrants | Haiti | 49.7 /100 | #175 | Average 47.3% |
| Ecuadorians | 46.7 /100 | #176 | Average 47.4% |
| Haitians | 44.6 /100 | #177 | Average 47.4% |
| Cubans | 42.1 /100 | #178 | Average 47.4% |
| Sierra Leoneans | 41.7 /100 | #179 | Average 47.4% |
| Immigrants | Ecuador | 41.7 /100 | #180 | Average 47.4% |
| Immigrants | Kazakhstan | 40.4 /100 | #181 | Average 47.4% |
| Immigrants | Moldova | 39.9 /100 | #182 | Fair 47.4% |
| Delaware | 39.1 /100 | #183 | Fair 47.5% |
| Immigrants | Nigeria | 34.0 /100 | #184 | Fair 47.5% |
| Ghanaians | 33.0 /100 | #185 | Fair 47.5% |
| Sudanese | 32.0 /100 | #186 | Fair 47.5% |
| Immigrants | Sudan | 31.8 /100 | #187 | Fair 47.5% |
| Basques | 30.9 /100 | #188 | Fair 47.6% |
| Immigrants | Kenya | 30.8 /100 | #189 | Fair 47.6% |
Demographics Similar to Immigrants from Caribbean by Disability Age Over 75
In terms of disability age over 75, the demographic groups most similar to Immigrants from Caribbean are Native Hawaiian (48.3%, a difference of 0.040%), French American Indian (48.3%, a difference of 0.040%), Tongan (48.3%, a difference of 0.050%), Afghan (48.4%, a difference of 0.090%), and American (48.4%, a difference of 0.11%).
| Demographics | Rating | Rank | Disability Age Over 75 |
| Immigrants | Nicaragua | 3.2 /100 | #236 | Tragic 48.2% |
| Immigrants | St. Vincent and the Grenadines | 3.2 /100 | #237 | Tragic 48.2% |
| Nicaraguans | 3.0 /100 | #238 | Tragic 48.3% |
| Immigrants | Thailand | 2.8 /100 | #239 | Tragic 48.3% |
| Tongans | 2.3 /100 | #240 | Tragic 48.3% |
| Native Hawaiians | 2.2 /100 | #241 | Tragic 48.3% |
| French American Indians | 2.2 /100 | #242 | Tragic 48.3% |
| Immigrants | Caribbean | 2.1 /100 | #243 | Tragic 48.4% |
| Afghans | 1.8 /100 | #244 | Tragic 48.4% |
| Americans | 1.7 /100 | #245 | Tragic 48.4% |
| Chippewa | 1.6 /100 | #246 | Tragic 48.4% |
| Iroquois | 1.6 /100 | #247 | Tragic 48.4% |
| Sri Lankans | 1.4 /100 | #248 | Tragic 48.5% |
| Iraqis | 1.0 /100 | #249 | Tragic 48.6% |
| West Indians | 0.8 /100 | #250 | Tragic 48.6% |