Immigrants from Cuba vs German Russian Disability Age Over 75
COMPARE
Immigrants from Cuba
German Russian
Disability Age Over 75
Disability Age Over 75 Comparison
Immigrants from Cuba
German Russians
47.7%
DISABILITY AGE OVER 75
20.9/ 100
METRIC RATING
201st/ 347
METRIC RANK
47.3%
DISABILITY AGE OVER 75
56.2/ 100
METRIC RATING
170th/ 347
METRIC RANK
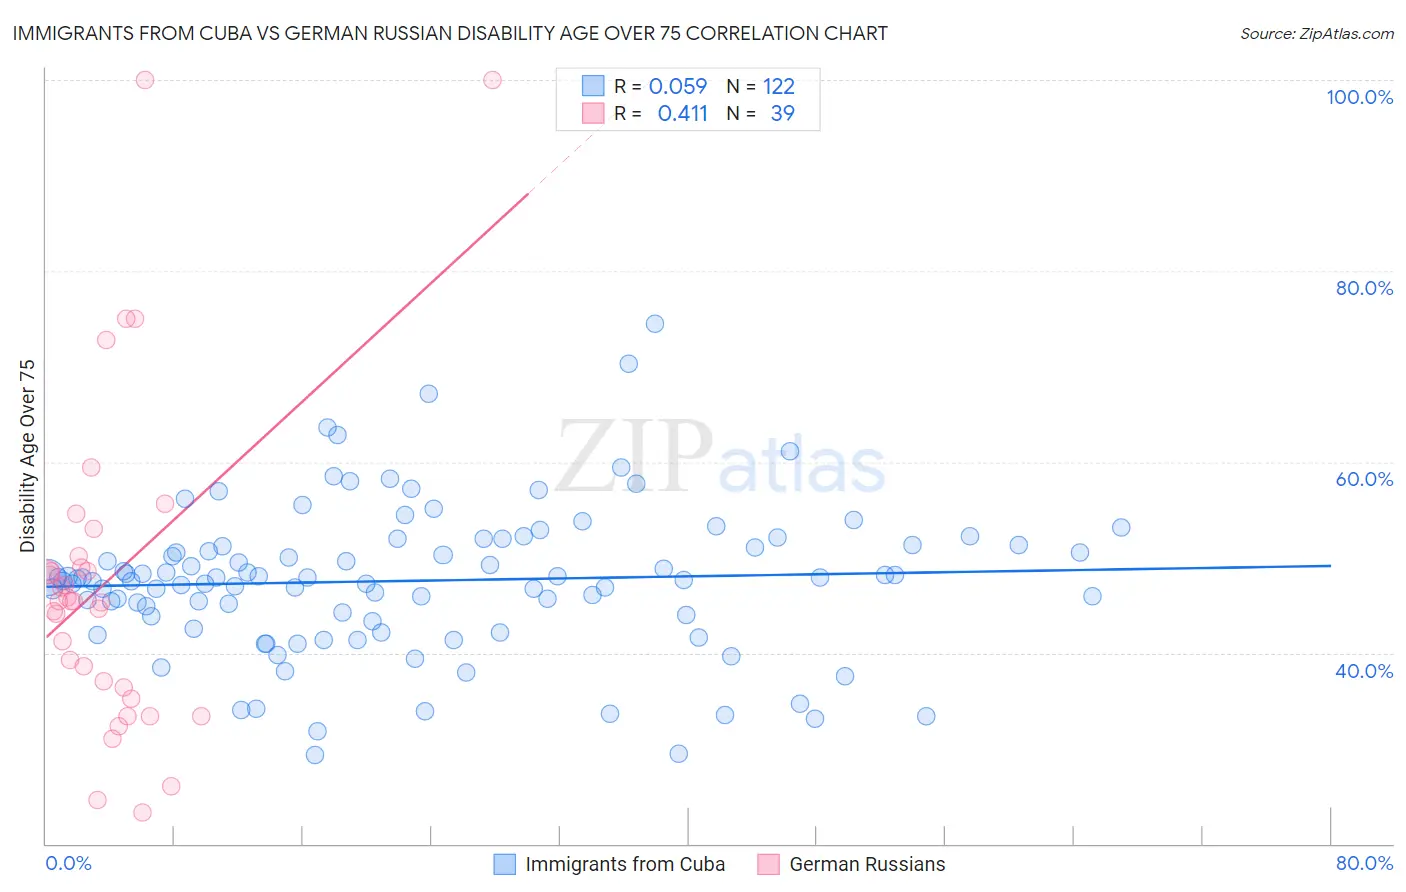
Immigrants from Cuba vs German Russian Disability Age Over 75 Correlation Chart
The statistical analysis conducted on geographies consisting of 325,674,246 people shows a slight positive correlation between the proportion of Immigrants from Cuba and percentage of population with a disability over the age of 75 in the United States with a correlation coefficient (R) of 0.059 and weighted average of 47.7%. Similarly, the statistical analysis conducted on geographies consisting of 96,358,240 people shows a moderate positive correlation between the proportion of German Russians and percentage of population with a disability over the age of 75 in the United States with a correlation coefficient (R) of 0.411 and weighted average of 47.3%, a difference of 0.89%.
Disability Age Over 75 Correlation Summary
| Measurement | Immigrants from Cuba | German Russian |
| Minimum | 29.3% | 23.2% |
| Maximum | 74.4% | 100.0% |
| Range | 45.1% | 76.8% |
| Mean | 47.5% | 47.6% |
| Median | 47.8% | 45.4% |
| Interquartile 25% (IQ1) | 43.9% | 36.4% |
| Interquartile 75% (IQ3) | 51.2% | 50.2% |
| Interquartile Range (IQR) | 7.3% | 13.8% |
| Standard Deviation (Sample) | 7.8% | 17.2% |
| Standard Deviation (Population) | 7.7% | 17.0% |
Similar Demographics by Disability Age Over 75
Demographics Similar to Immigrants from Cuba by Disability Age Over 75
In terms of disability age over 75, the demographic groups most similar to Immigrants from Cuba are Immigrants from Bahamas (47.7%, a difference of 0.010%), Immigrants from Somalia (47.7%, a difference of 0.020%), Trinidadian and Tobagonian (47.7%, a difference of 0.030%), Immigrants from Eritrea (47.7%, a difference of 0.050%), and Nigerian (47.7%, a difference of 0.060%).
| Demographics | Rating | Rank | Disability Age Over 75 |
| Immigrants | Lebanon | 26.5 /100 | #194 | Fair 47.6% |
| Immigrants | Trinidad and Tobago | 25.3 /100 | #195 | Fair 47.6% |
| Immigrants | Portugal | 23.8 /100 | #196 | Fair 47.6% |
| Pakistanis | 23.4 /100 | #197 | Fair 47.7% |
| Immigrants | Ukraine | 23.2 /100 | #198 | Fair 47.7% |
| Immigrants | Eritrea | 22.4 /100 | #199 | Fair 47.7% |
| Immigrants | Somalia | 21.4 /100 | #200 | Fair 47.7% |
| Immigrants | Cuba | 20.9 /100 | #201 | Fair 47.7% |
| Immigrants | Bahamas | 20.7 /100 | #202 | Fair 47.7% |
| Trinidadians and Tobagonians | 20.0 /100 | #203 | Fair 47.7% |
| Nigerians | 19.2 /100 | #204 | Poor 47.7% |
| Immigrants | Ghana | 19.1 /100 | #205 | Poor 47.7% |
| Jamaicans | 19.0 /100 | #206 | Poor 47.7% |
| Immigrants | Syria | 17.4 /100 | #207 | Poor 47.8% |
| Immigrants | Senegal | 16.9 /100 | #208 | Poor 47.8% |
Demographics Similar to German Russians by Disability Age Over 75
In terms of disability age over 75, the demographic groups most similar to German Russians are Kenyan (47.2%, a difference of 0.060%), Celtic (47.2%, a difference of 0.060%), Immigrants from Africa (47.3%, a difference of 0.060%), Scotch-Irish (47.3%, a difference of 0.080%), and Alsatian (47.3%, a difference of 0.10%).
| Demographics | Rating | Rank | Disability Age Over 75 |
| Immigrants | Eastern Africa | 65.5 /100 | #163 | Good 47.2% |
| French | 64.6 /100 | #164 | Good 47.2% |
| Immigrants | Zimbabwe | 64.4 /100 | #165 | Good 47.2% |
| Immigrants | Sierra Leone | 64.4 /100 | #166 | Good 47.2% |
| Moroccans | 62.9 /100 | #167 | Good 47.2% |
| Kenyans | 58.8 /100 | #168 | Average 47.2% |
| Celtics | 58.7 /100 | #169 | Average 47.2% |
| German Russians | 56.2 /100 | #170 | Average 47.3% |
| Immigrants | Africa | 53.6 /100 | #171 | Average 47.3% |
| Scotch-Irish | 52.5 /100 | #172 | Average 47.3% |
| Alsatians | 51.9 /100 | #173 | Average 47.3% |
| Whites/Caucasians | 50.0 /100 | #174 | Average 47.3% |
| Immigrants | Haiti | 49.7 /100 | #175 | Average 47.3% |
| Ecuadorians | 46.7 /100 | #176 | Average 47.4% |
| Haitians | 44.6 /100 | #177 | Average 47.4% |