Immigrants from Moldova vs Immigrants from Cuba Disability Age Over 75
COMPARE
Immigrants from Moldova
Immigrants from Cuba
Disability Age Over 75
Disability Age Over 75 Comparison
Immigrants from Moldova
Immigrants from Cuba
47.4%
DISABILITY AGE OVER 75
39.9/ 100
METRIC RATING
182nd/ 347
METRIC RANK
47.7%
DISABILITY AGE OVER 75
20.9/ 100
METRIC RATING
201st/ 347
METRIC RANK
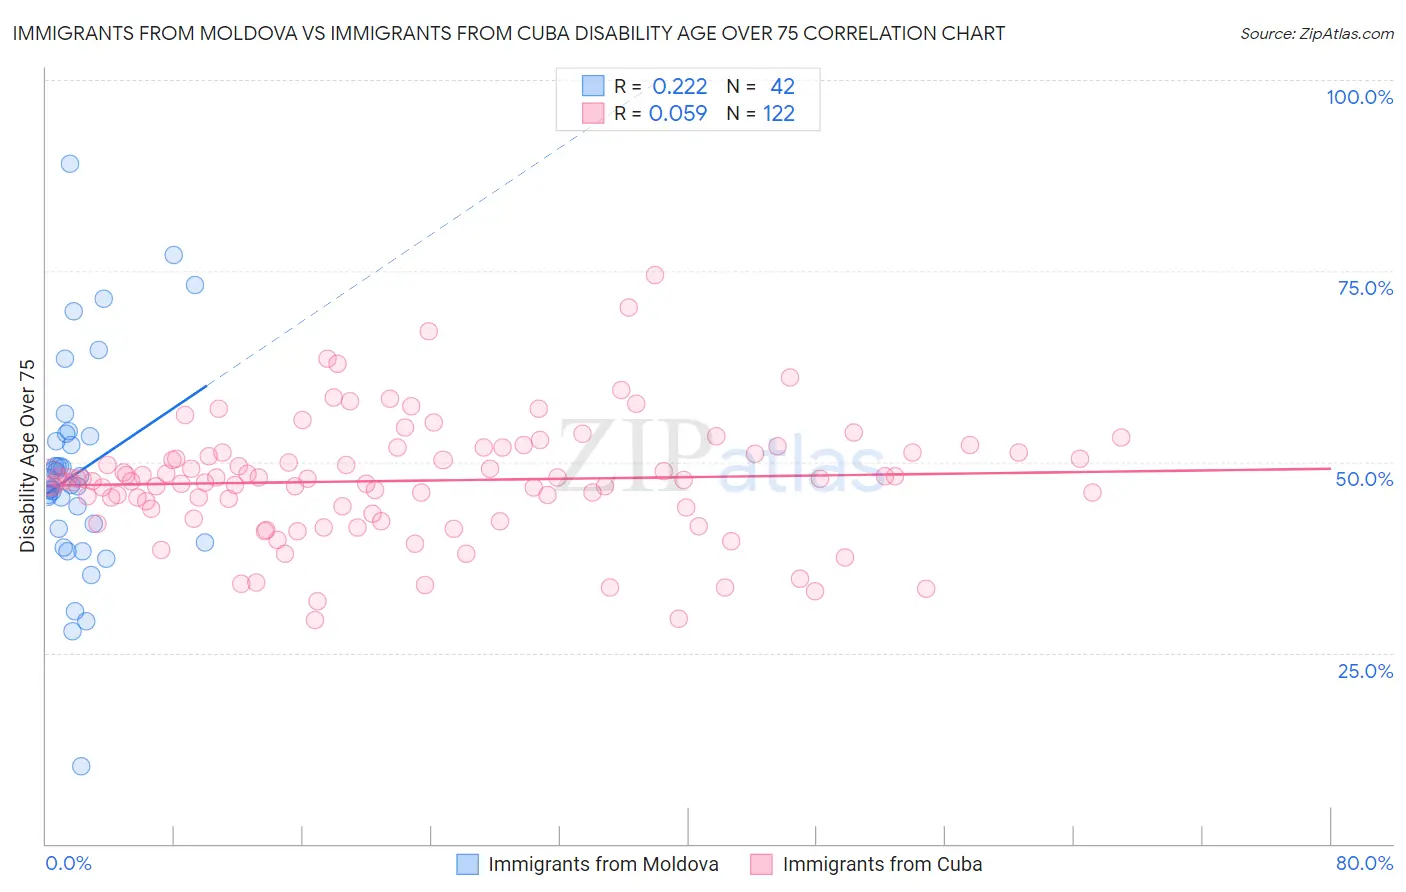
Immigrants from Moldova vs Immigrants from Cuba Disability Age Over 75 Correlation Chart
The statistical analysis conducted on geographies consisting of 124,351,560 people shows a weak positive correlation between the proportion of Immigrants from Moldova and percentage of population with a disability over the age of 75 in the United States with a correlation coefficient (R) of 0.222 and weighted average of 47.4%. Similarly, the statistical analysis conducted on geographies consisting of 325,674,246 people shows a slight positive correlation between the proportion of Immigrants from Cuba and percentage of population with a disability over the age of 75 in the United States with a correlation coefficient (R) of 0.059 and weighted average of 47.7%, a difference of 0.52%.
Disability Age Over 75 Correlation Summary
| Measurement | Immigrants from Moldova | Immigrants from Cuba |
| Minimum | 10.1% | 29.3% |
| Maximum | 89.0% | 74.4% |
| Range | 78.9% | 45.1% |
| Mean | 48.6% | 47.5% |
| Median | 47.2% | 47.8% |
| Interquartile 25% (IQ1) | 41.3% | 43.9% |
| Interquartile 75% (IQ3) | 53.4% | 51.2% |
| Interquartile Range (IQR) | 12.1% | 7.3% |
| Standard Deviation (Sample) | 14.1% | 7.8% |
| Standard Deviation (Population) | 13.9% | 7.7% |
Demographics Similar to Immigrants from Moldova and Immigrants from Cuba by Disability Age Over 75
In terms of disability age over 75, the demographic groups most similar to Immigrants from Moldova are Immigrants from Kazakhstan (47.4%, a difference of 0.010%), Delaware (47.5%, a difference of 0.020%), Immigrants from Nigeria (47.5%, a difference of 0.14%), Ghanaian (47.5%, a difference of 0.17%), and Sudanese (47.5%, a difference of 0.19%). Similarly, the demographic groups most similar to Immigrants from Cuba are Immigrants from Somalia (47.7%, a difference of 0.020%), Immigrants from Eritrea (47.7%, a difference of 0.050%), Pakistani (47.7%, a difference of 0.080%), Immigrants from Ukraine (47.7%, a difference of 0.080%), and Immigrants from Portugal (47.6%, a difference of 0.090%).
| Demographics | Rating | Rank | Disability Age Over 75 |
| Immigrants | Kazakhstan | 40.4 /100 | #181 | Average 47.4% |
| Immigrants | Moldova | 39.9 /100 | #182 | Fair 47.4% |
| Delaware | 39.1 /100 | #183 | Fair 47.5% |
| Immigrants | Nigeria | 34.0 /100 | #184 | Fair 47.5% |
| Ghanaians | 33.0 /100 | #185 | Fair 47.5% |
| Sudanese | 32.0 /100 | #186 | Fair 47.5% |
| Immigrants | Sudan | 31.8 /100 | #187 | Fair 47.5% |
| Basques | 30.9 /100 | #188 | Fair 47.6% |
| Immigrants | Kenya | 30.8 /100 | #189 | Fair 47.6% |
| Somalis | 29.5 /100 | #190 | Fair 47.6% |
| Portuguese | 29.3 /100 | #191 | Fair 47.6% |
| Immigrants | Jamaica | 28.3 /100 | #192 | Fair 47.6% |
| Ottawa | 28.1 /100 | #193 | Fair 47.6% |
| Immigrants | Lebanon | 26.5 /100 | #194 | Fair 47.6% |
| Immigrants | Trinidad and Tobago | 25.3 /100 | #195 | Fair 47.6% |
| Immigrants | Portugal | 23.8 /100 | #196 | Fair 47.6% |
| Pakistanis | 23.4 /100 | #197 | Fair 47.7% |
| Immigrants | Ukraine | 23.2 /100 | #198 | Fair 47.7% |
| Immigrants | Eritrea | 22.4 /100 | #199 | Fair 47.7% |
| Immigrants | Somalia | 21.4 /100 | #200 | Fair 47.7% |
| Immigrants | Cuba | 20.9 /100 | #201 | Fair 47.7% |