Immigrants vs German Russian Disability Age Over 75
COMPARE
Immigrants
German Russian
Disability Age Over 75
Disability Age Over 75 Comparison
Immigrants
German Russians
48.2%
DISABILITY AGE OVER 75
4.3/ 100
METRIC RATING
231st/ 347
METRIC RANK
47.3%
DISABILITY AGE OVER 75
56.2/ 100
METRIC RATING
170th/ 347
METRIC RANK
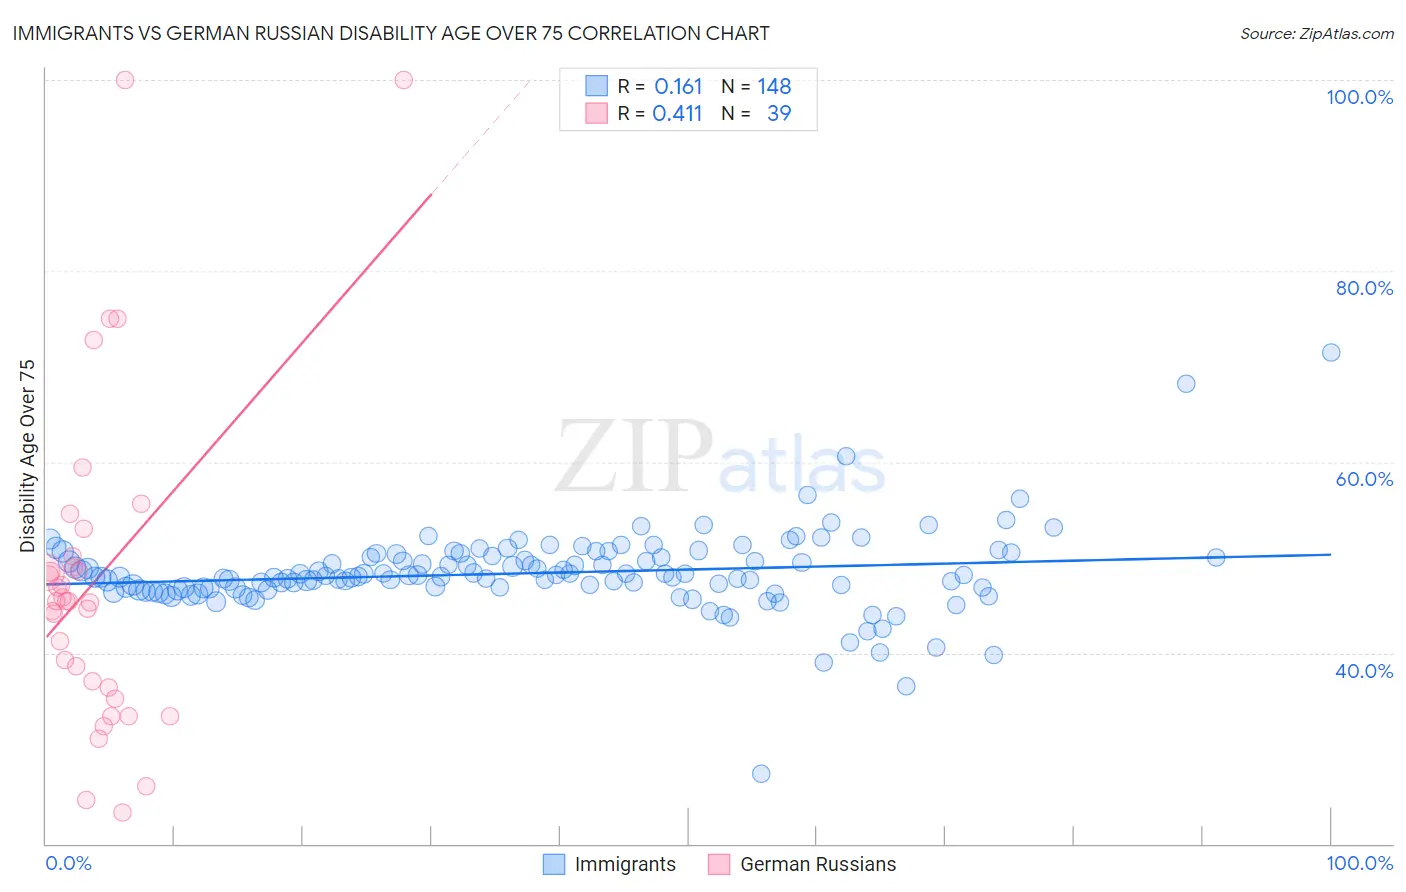
Immigrants vs German Russian Disability Age Over 75 Correlation Chart
The statistical analysis conducted on geographies consisting of 575,317,418 people shows a poor positive correlation between the proportion of Immigrants and percentage of population with a disability over the age of 75 in the United States with a correlation coefficient (R) of 0.161 and weighted average of 48.2%. Similarly, the statistical analysis conducted on geographies consisting of 96,358,240 people shows a moderate positive correlation between the proportion of German Russians and percentage of population with a disability over the age of 75 in the United States with a correlation coefficient (R) of 0.411 and weighted average of 47.3%, a difference of 1.9%.
Disability Age Over 75 Correlation Summary
| Measurement | Immigrants | German Russian |
| Minimum | 27.4% | 23.2% |
| Maximum | 71.4% | 100.0% |
| Range | 44.1% | 76.8% |
| Mean | 48.3% | 47.6% |
| Median | 48.0% | 45.4% |
| Interquartile 25% (IQ1) | 46.7% | 36.4% |
| Interquartile 75% (IQ3) | 50.1% | 50.2% |
| Interquartile Range (IQR) | 3.3% | 13.8% |
| Standard Deviation (Sample) | 4.4% | 17.2% |
| Standard Deviation (Population) | 4.4% | 17.0% |
Similar Demographics by Disability Age Over 75
Demographics Similar to Immigrants by Disability Age Over 75
In terms of disability age over 75, the demographic groups most similar to Immigrants are Taiwanese (48.2%, a difference of 0.010%), Indonesian (48.2%, a difference of 0.010%), Cree (48.2%, a difference of 0.020%), Subsaharan African (48.2%, a difference of 0.080%), and Hmong (48.2%, a difference of 0.080%).
| Demographics | Rating | Rank | Disability Age Over 75 |
| Liberians | 6.7 /100 | #224 | Tragic 48.0% |
| Spanish | 6.5 /100 | #225 | Tragic 48.0% |
| Immigrants | Nonimmigrants | 6.5 /100 | #226 | Tragic 48.0% |
| Zimbabweans | 6.4 /100 | #227 | Tragic 48.1% |
| Immigrants | Liberia | 5.9 /100 | #228 | Tragic 48.1% |
| Spaniards | 5.7 /100 | #229 | Tragic 48.1% |
| Taiwanese | 4.4 /100 | #230 | Tragic 48.2% |
| Immigrants | Immigrants | 4.3 /100 | #231 | Tragic 48.2% |
| Indonesians | 4.2 /100 | #232 | Tragic 48.2% |
| Cree | 4.2 /100 | #233 | Tragic 48.2% |
| Sub-Saharan Africans | 3.8 /100 | #234 | Tragic 48.2% |
| Hmong | 3.8 /100 | #235 | Tragic 48.2% |
| Immigrants | Nicaragua | 3.2 /100 | #236 | Tragic 48.2% |
| Immigrants | St. Vincent and the Grenadines | 3.2 /100 | #237 | Tragic 48.2% |
| Nicaraguans | 3.0 /100 | #238 | Tragic 48.3% |
Demographics Similar to German Russians by Disability Age Over 75
In terms of disability age over 75, the demographic groups most similar to German Russians are Kenyan (47.2%, a difference of 0.060%), Celtic (47.2%, a difference of 0.060%), Immigrants from Africa (47.3%, a difference of 0.060%), Scotch-Irish (47.3%, a difference of 0.080%), and Alsatian (47.3%, a difference of 0.10%).
| Demographics | Rating | Rank | Disability Age Over 75 |
| Immigrants | Eastern Africa | 65.5 /100 | #163 | Good 47.2% |
| French | 64.6 /100 | #164 | Good 47.2% |
| Immigrants | Zimbabwe | 64.4 /100 | #165 | Good 47.2% |
| Immigrants | Sierra Leone | 64.4 /100 | #166 | Good 47.2% |
| Moroccans | 62.9 /100 | #167 | Good 47.2% |
| Kenyans | 58.8 /100 | #168 | Average 47.2% |
| Celtics | 58.7 /100 | #169 | Average 47.2% |
| German Russians | 56.2 /100 | #170 | Average 47.3% |
| Immigrants | Africa | 53.6 /100 | #171 | Average 47.3% |
| Scotch-Irish | 52.5 /100 | #172 | Average 47.3% |
| Alsatians | 51.9 /100 | #173 | Average 47.3% |
| Whites/Caucasians | 50.0 /100 | #174 | Average 47.3% |
| Immigrants | Haiti | 49.7 /100 | #175 | Average 47.3% |
| Ecuadorians | 46.7 /100 | #176 | Average 47.4% |
| Haitians | 44.6 /100 | #177 | Average 47.4% |