Immigrants from Belarus vs German Russian Disability Age Over 75
COMPARE
Immigrants from Belarus
German Russian
Disability Age Over 75
Disability Age Over 75 Comparison
Immigrants from Belarus
German Russians
47.1%
DISABILITY AGE OVER 75
74.8/ 100
METRIC RATING
154th/ 347
METRIC RANK
47.3%
DISABILITY AGE OVER 75
56.2/ 100
METRIC RATING
170th/ 347
METRIC RANK
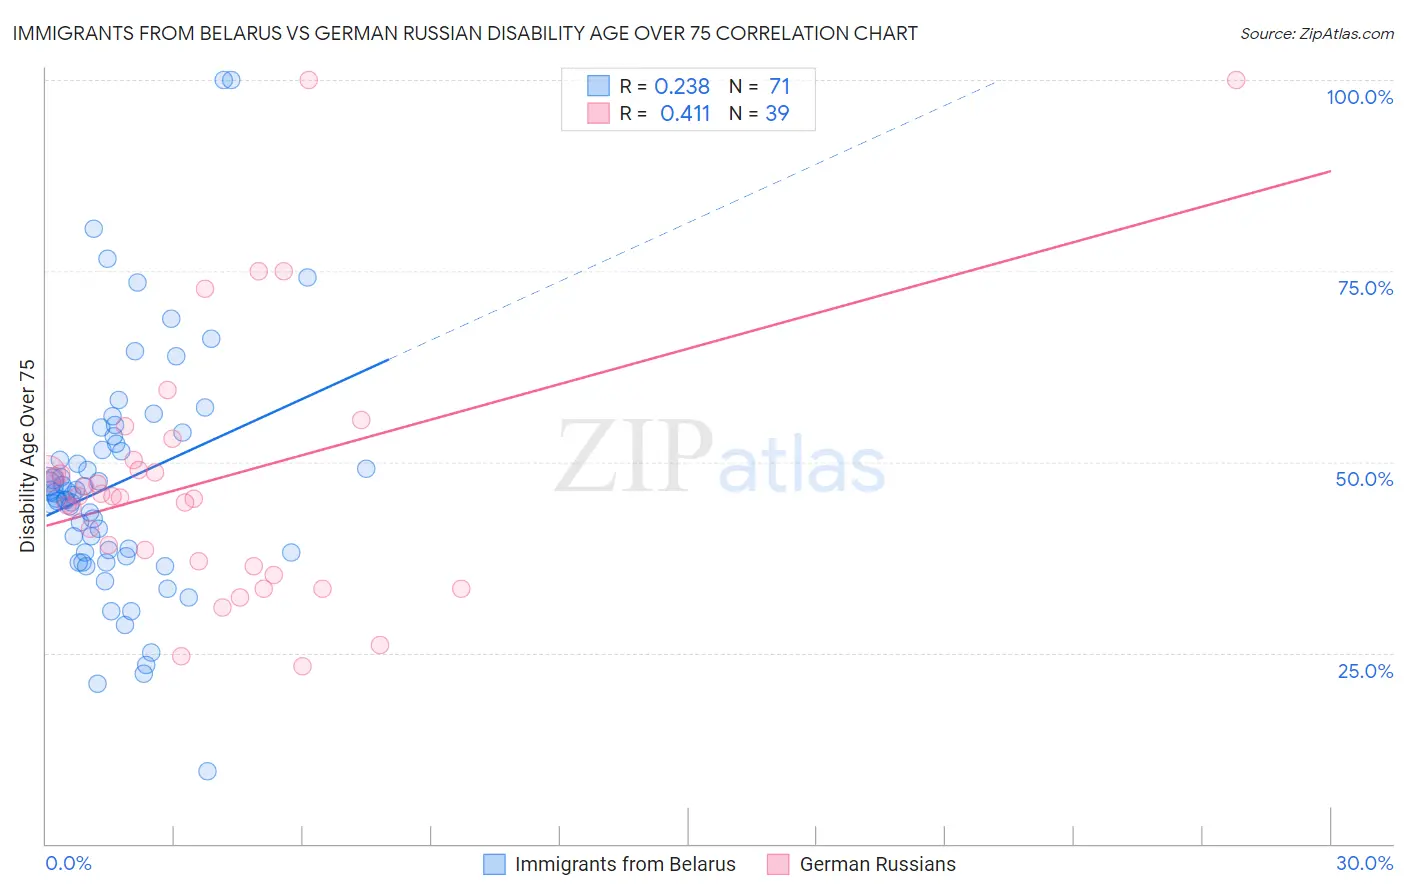
Immigrants from Belarus vs German Russian Disability Age Over 75 Correlation Chart
The statistical analysis conducted on geographies consisting of 150,140,407 people shows a weak positive correlation between the proportion of Immigrants from Belarus and percentage of population with a disability over the age of 75 in the United States with a correlation coefficient (R) of 0.238 and weighted average of 47.1%. Similarly, the statistical analysis conducted on geographies consisting of 96,358,240 people shows a moderate positive correlation between the proportion of German Russians and percentage of population with a disability over the age of 75 in the United States with a correlation coefficient (R) of 0.411 and weighted average of 47.3%, a difference of 0.47%.
Disability Age Over 75 Correlation Summary
| Measurement | Immigrants from Belarus | German Russian |
| Minimum | 9.5% | 23.2% |
| Maximum | 100.0% | 100.0% |
| Range | 90.5% | 76.8% |
| Mean | 47.2% | 47.6% |
| Median | 46.0% | 45.4% |
| Interquartile 25% (IQ1) | 38.1% | 36.4% |
| Interquartile 75% (IQ3) | 53.4% | 50.2% |
| Interquartile Range (IQR) | 15.3% | 13.8% |
| Standard Deviation (Sample) | 15.8% | 17.2% |
| Standard Deviation (Population) | 15.7% | 17.0% |
Demographics Similar to Immigrants from Belarus and German Russians by Disability Age Over 75
In terms of disability age over 75, the demographic groups most similar to Immigrants from Belarus are Immigrants from Zaire (47.1%, a difference of 0.0%), Immigrants from Iran (47.1%, a difference of 0.0%), Arab (47.1%, a difference of 0.040%), Immigrants from Asia (47.0%, a difference of 0.050%), and Bhutanese (47.1%, a difference of 0.060%). Similarly, the demographic groups most similar to German Russians are Kenyan (47.2%, a difference of 0.060%), Celtic (47.2%, a difference of 0.060%), Immigrants from Africa (47.3%, a difference of 0.060%), Scotch-Irish (47.3%, a difference of 0.080%), and Moroccan (47.2%, a difference of 0.16%).
| Demographics | Rating | Rank | Disability Age Over 75 |
| Immigrants | Asia | 76.5 /100 | #152 | Good 47.0% |
| Immigrants | Zaire | 74.8 /100 | #153 | Good 47.1% |
| Immigrants | Belarus | 74.8 /100 | #154 | Good 47.1% |
| Immigrants | Iran | 74.7 /100 | #155 | Good 47.1% |
| Arabs | 73.3 /100 | #156 | Good 47.1% |
| Bhutanese | 72.6 /100 | #157 | Good 47.1% |
| Immigrants | Guyana | 71.9 /100 | #158 | Good 47.1% |
| Immigrants | Morocco | 71.4 /100 | #159 | Good 47.1% |
| Immigrants | Middle Africa | 68.3 /100 | #160 | Good 47.1% |
| South American Indians | 68.1 /100 | #161 | Good 47.1% |
| Pennsylvania Germans | 66.0 /100 | #162 | Good 47.2% |
| Immigrants | Eastern Africa | 65.5 /100 | #163 | Good 47.2% |
| French | 64.6 /100 | #164 | Good 47.2% |
| Immigrants | Zimbabwe | 64.4 /100 | #165 | Good 47.2% |
| Immigrants | Sierra Leone | 64.4 /100 | #166 | Good 47.2% |
| Moroccans | 62.9 /100 | #167 | Good 47.2% |
| Kenyans | 58.8 /100 | #168 | Average 47.2% |
| Celtics | 58.7 /100 | #169 | Average 47.2% |
| German Russians | 56.2 /100 | #170 | Average 47.3% |
| Immigrants | Africa | 53.6 /100 | #171 | Average 47.3% |
| Scotch-Irish | 52.5 /100 | #172 | Average 47.3% |