Immigrants from India vs Scottish Male Disability
COMPARE
Immigrants from India
Scottish
Male Disability
Male Disability Comparison
Immigrants from India
Scottish
9.0%
MALE DISABILITY
100.0/ 100
METRIC RATING
1st/ 347
METRIC RANK
12.8%
MALE DISABILITY
0.0/ 100
METRIC RATING
286th/ 347
METRIC RANK
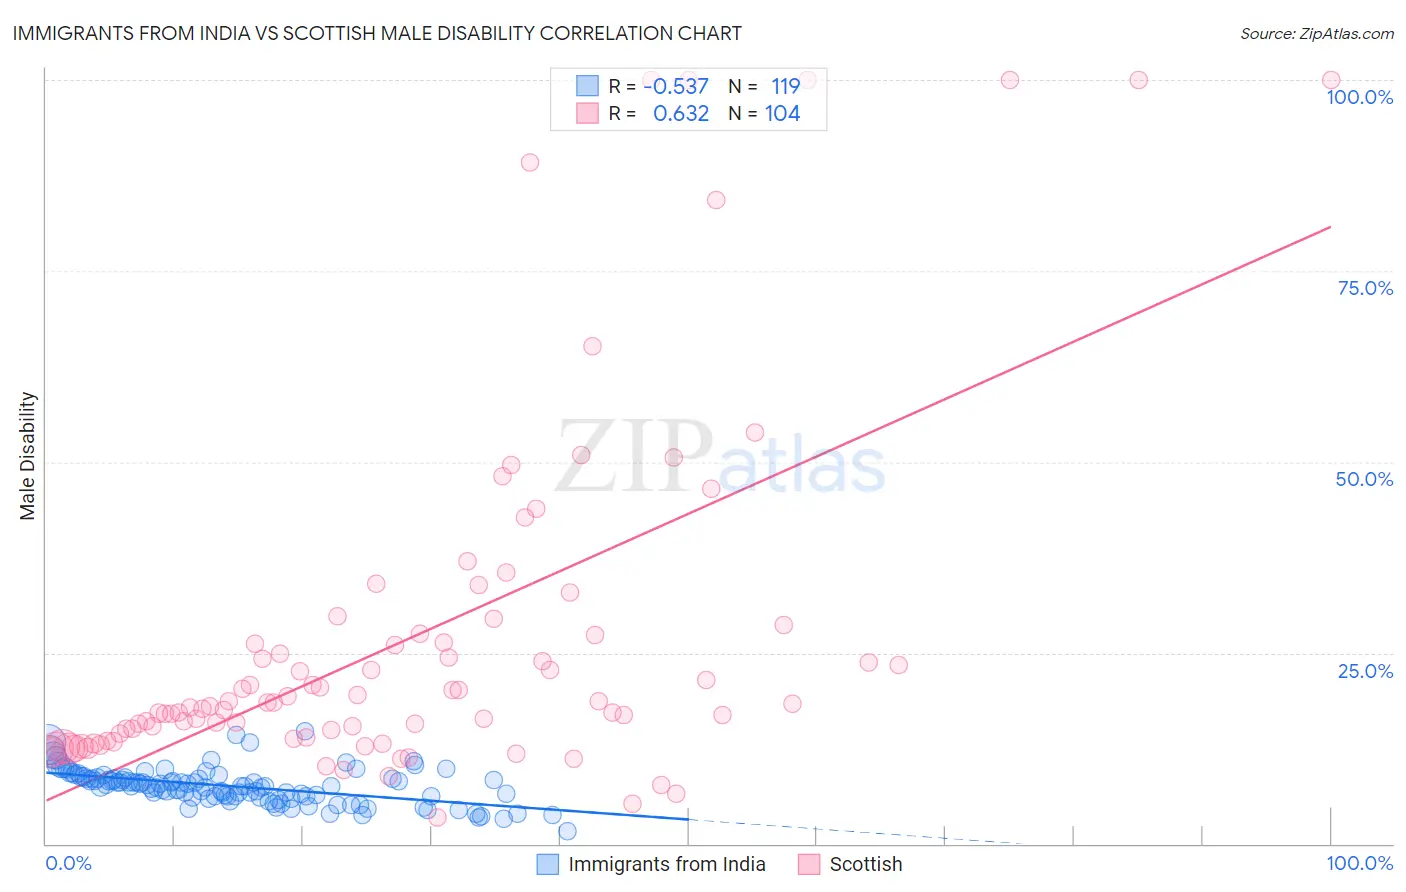
Immigrants from India vs Scottish Male Disability Correlation Chart
The statistical analysis conducted on geographies consisting of 434,062,130 people shows a substantial negative correlation between the proportion of Immigrants from India and percentage of males with a disability in the United States with a correlation coefficient (R) of -0.537 and weighted average of 9.0%. Similarly, the statistical analysis conducted on geographies consisting of 566,868,484 people shows a significant positive correlation between the proportion of Scottish and percentage of males with a disability in the United States with a correlation coefficient (R) of 0.632 and weighted average of 12.8%, a difference of 41.2%.
Male Disability Correlation Summary
| Measurement | Immigrants from India | Scottish |
| Minimum | 1.6% | 3.4% |
| Maximum | 14.7% | 100.0% |
| Range | 13.0% | 96.6% |
| Mean | 7.5% | 27.0% |
| Median | 7.6% | 18.4% |
| Interquartile 25% (IQ1) | 6.2% | 14.2% |
| Interquartile 75% (IQ3) | 8.6% | 27.4% |
| Interquartile Range (IQR) | 2.5% | 13.2% |
| Standard Deviation (Sample) | 2.3% | 23.1% |
| Standard Deviation (Population) | 2.3% | 23.0% |
Similar Demographics by Male Disability
Demographics Similar to Immigrants from India by Male Disability
In terms of male disability, the demographic groups most similar to Immigrants from India are Immigrants from Taiwan (9.1%, a difference of 0.89%), Filipino (9.1%, a difference of 0.90%), Thai (9.2%, a difference of 2.2%), Immigrants from Hong Kong (9.4%, a difference of 4.4%), and Immigrants from South Central Asia (9.4%, a difference of 4.4%).
| Demographics | Rating | Rank | Male Disability |
| Immigrants | India | 100.0 /100 | #1 | Exceptional 9.0% |
| Immigrants | Taiwan | 100.0 /100 | #2 | Exceptional 9.1% |
| Filipinos | 100.0 /100 | #3 | Exceptional 9.1% |
| Thais | 100.0 /100 | #4 | Exceptional 9.2% |
| Immigrants | Hong Kong | 100.0 /100 | #5 | Exceptional 9.4% |
| Immigrants | South Central Asia | 100.0 /100 | #6 | Exceptional 9.4% |
| Immigrants | Bolivia | 100.0 /100 | #7 | Exceptional 9.5% |
| Immigrants | China | 100.0 /100 | #8 | Exceptional 9.5% |
| Immigrants | Singapore | 100.0 /100 | #9 | Exceptional 9.5% |
| Immigrants | Israel | 100.0 /100 | #10 | Exceptional 9.6% |
| Immigrants | Eastern Asia | 100.0 /100 | #11 | Exceptional 9.6% |
| Bolivians | 100.0 /100 | #12 | Exceptional 9.6% |
| Iranians | 100.0 /100 | #13 | Exceptional 9.7% |
| Immigrants | Iran | 100.0 /100 | #14 | Exceptional 9.7% |
| Indians (Asian) | 100.0 /100 | #15 | Exceptional 9.7% |
Demographics Similar to Scottish by Male Disability
In terms of male disability, the demographic groups most similar to Scottish are Welsh (12.7%, a difference of 0.050%), Spanish (12.7%, a difference of 0.060%), Cape Verdean (12.8%, a difference of 0.070%), Yup'ik (12.8%, a difference of 0.26%), and German (12.7%, a difference of 0.32%).
| Demographics | Rating | Rank | Male Disability |
| Slovaks | 0.0 /100 | #279 | Tragic 12.7% |
| Dutch | 0.0 /100 | #280 | Tragic 12.7% |
| Sioux | 0.0 /100 | #281 | Tragic 12.7% |
| Irish | 0.0 /100 | #282 | Tragic 12.7% |
| Germans | 0.0 /100 | #283 | Tragic 12.7% |
| Spanish | 0.0 /100 | #284 | Tragic 12.7% |
| Welsh | 0.0 /100 | #285 | Tragic 12.7% |
| Scottish | 0.0 /100 | #286 | Tragic 12.8% |
| Cape Verdeans | 0.0 /100 | #287 | Tragic 12.8% |
| Yup'ik | 0.0 /100 | #288 | Tragic 12.8% |
| Immigrants | Cabo Verde | 0.0 /100 | #289 | Tragic 12.8% |
| Pima | 0.0 /100 | #290 | Tragic 12.8% |
| Whites/Caucasians | 0.0 /100 | #291 | Tragic 12.8% |
| English | 0.0 /100 | #292 | Tragic 12.8% |
| Yaqui | 0.0 /100 | #293 | Tragic 12.9% |