Immigrants from Middle Africa vs Immigrants from Micronesia Disability Age Under 5
COMPARE
Immigrants from Middle Africa
Immigrants from Micronesia
Disability Age Under 5
Disability Age Under 5 Comparison
Immigrants from Middle Africa
Immigrants from Micronesia
1.2%
DISABILITY AGE UNDER 5
79.3/ 100
METRIC RATING
144th/ 347
METRIC RANK
1.0%
DISABILITY AGE UNDER 5
100.0/ 100
METRIC RATING
25th/ 347
METRIC RANK
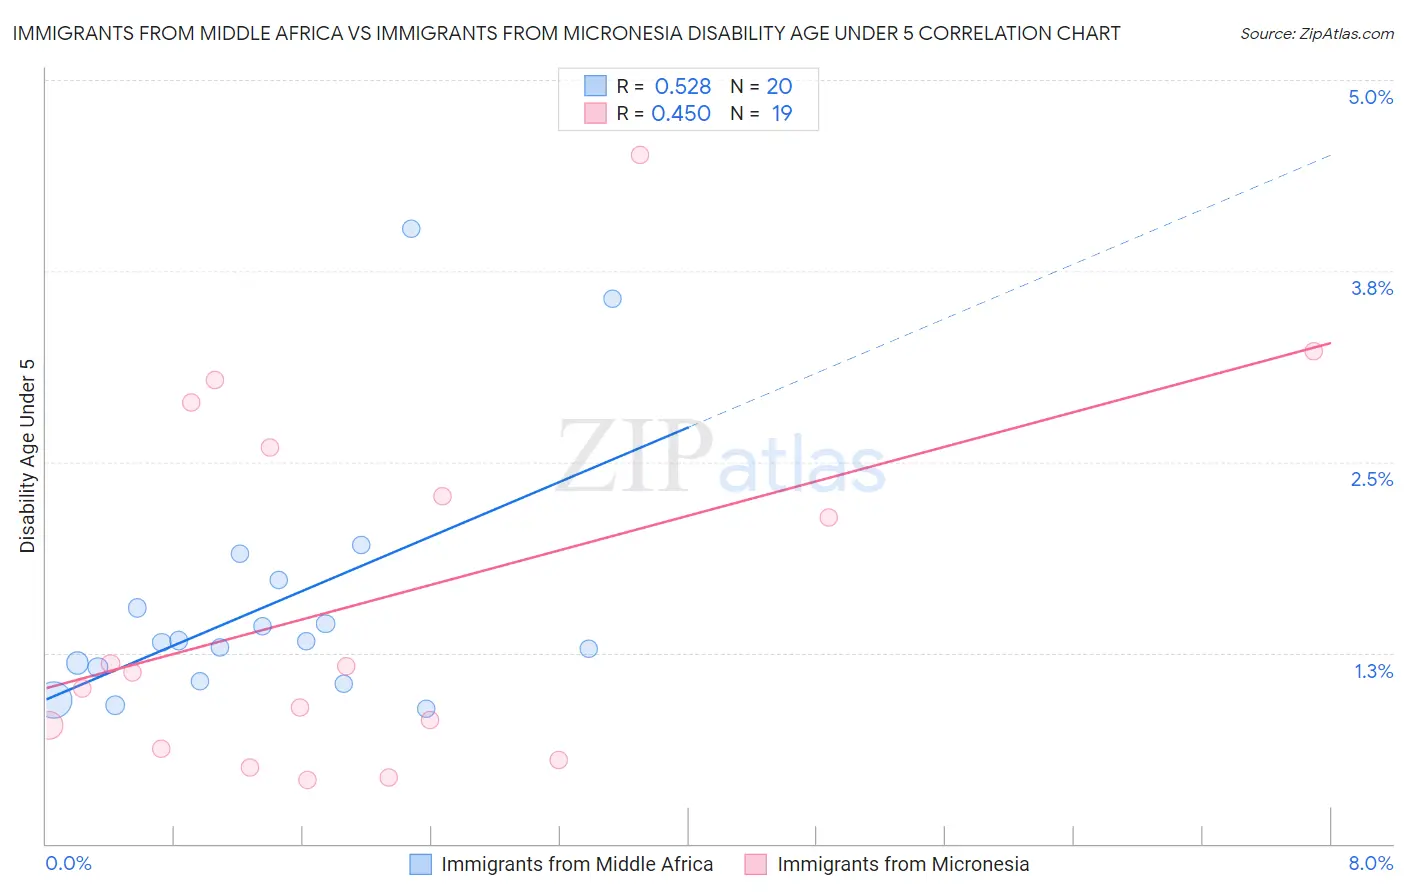
Immigrants from Middle Africa vs Immigrants from Micronesia Disability Age Under 5 Correlation Chart
The statistical analysis conducted on geographies consisting of 135,378,258 people shows a substantial positive correlation between the proportion of Immigrants from Middle Africa and percentage of population with a disability under the age of 5 in the United States with a correlation coefficient (R) of 0.528 and weighted average of 1.2%. Similarly, the statistical analysis conducted on geographies consisting of 52,170,581 people shows a moderate positive correlation between the proportion of Immigrants from Micronesia and percentage of population with a disability under the age of 5 in the United States with a correlation coefficient (R) of 0.450 and weighted average of 1.0%, a difference of 19.6%.
Disability Age Under 5 Correlation Summary
| Measurement | Immigrants from Middle Africa | Immigrants from Micronesia |
| Minimum | 0.88% | 0.42% |
| Maximum | 4.0% | 4.5% |
| Range | 3.1% | 4.1% |
| Mean | 1.6% | 1.6% |
| Median | 1.3% | 1.1% |
| Interquartile 25% (IQ1) | 1.1% | 0.63% |
| Interquartile 75% (IQ3) | 1.6% | 2.6% |
| Interquartile Range (IQR) | 0.53% | 2.0% |
| Standard Deviation (Sample) | 0.82% | 1.2% |
| Standard Deviation (Population) | 0.80% | 1.2% |
Similar Demographics by Disability Age Under 5
Demographics Similar to Immigrants from Middle Africa by Disability Age Under 5
In terms of disability age under 5, the demographic groups most similar to Immigrants from Middle Africa are Alsatian (1.2%, a difference of 0.0%), Immigrants from Colombia (1.2%, a difference of 0.010%), Immigrants from Honduras (1.2%, a difference of 0.16%), Immigrants from Zimbabwe (1.2%, a difference of 0.18%), and Somali (1.2%, a difference of 0.22%).
| Demographics | Rating | Rank | Disability Age Under 5 |
| Immigrants | Eastern Africa | 83.1 /100 | #137 | Excellent 1.2% |
| Immigrants | Czechoslovakia | 82.8 /100 | #138 | Excellent 1.2% |
| New Zealanders | 81.4 /100 | #139 | Excellent 1.2% |
| Somalis | 80.8 /100 | #140 | Excellent 1.2% |
| Immigrants | Honduras | 80.4 /100 | #141 | Excellent 1.2% |
| Immigrants | Colombia | 79.3 /100 | #142 | Good 1.2% |
| Alsatians | 79.3 /100 | #143 | Good 1.2% |
| Immigrants | Middle Africa | 79.3 /100 | #144 | Good 1.2% |
| Immigrants | Zimbabwe | 77.9 /100 | #145 | Good 1.2% |
| Samoans | 77.7 /100 | #146 | Good 1.2% |
| Icelanders | 76.3 /100 | #147 | Good 1.2% |
| Ghanaians | 76.3 /100 | #148 | Good 1.2% |
| Kenyans | 75.9 /100 | #149 | Good 1.2% |
| South Americans | 75.6 /100 | #150 | Good 1.2% |
| Yaqui | 74.8 /100 | #151 | Good 1.2% |
Demographics Similar to Immigrants from Micronesia by Disability Age Under 5
In terms of disability age under 5, the demographic groups most similar to Immigrants from Micronesia are Immigrants from Taiwan (1.0%, a difference of 0.12%), Indian (Asian) (1.0%, a difference of 0.31%), Yakama (1.00%, a difference of 0.59%), Immigrants from Iran (1.00%, a difference of 0.67%), and Guyanese (1.0%, a difference of 0.97%).
| Demographics | Rating | Rank | Disability Age Under 5 |
| Immigrants | Barbados | 100.0 /100 | #18 | Exceptional 0.97% |
| Puget Sound Salish | 100.0 /100 | #19 | Exceptional 0.97% |
| Nepalese | 100.0 /100 | #20 | Exceptional 0.97% |
| British West Indians | 100.0 /100 | #21 | Exceptional 0.99% |
| Immigrants | Iran | 100.0 /100 | #22 | Exceptional 1.00% |
| Yakama | 100.0 /100 | #23 | Exceptional 1.00% |
| Indians (Asian) | 100.0 /100 | #24 | Exceptional 1.0% |
| Immigrants | Micronesia | 100.0 /100 | #25 | Exceptional 1.0% |
| Immigrants | Taiwan | 100.0 /100 | #26 | Exceptional 1.0% |
| Guyanese | 100.0 /100 | #27 | Exceptional 1.0% |
| Immigrants | Eastern Asia | 100.0 /100 | #28 | Exceptional 1.0% |
| Immigrants | Belarus | 100.0 /100 | #29 | Exceptional 1.0% |
| Immigrants | South Central Asia | 99.9 /100 | #30 | Exceptional 1.0% |
| Armenians | 99.9 /100 | #31 | Exceptional 1.0% |
| Iranians | 99.9 /100 | #32 | Exceptional 1.0% |