Immigrants from Moldova vs Immigrants from Micronesia Disability Age Under 5

COMPARE

Immigrants from Moldova
Race
Ancestry
AfghanAfricanAlaska NativeAlaskan AthabascanAlbanianAleutAlsatianAmericanApacheArabArapahoArgentineanArmenianAssyrian/Chaldean/SyriacAustralianAustrianBahamianBangladeshiBarbadianBasqueBelgianBelizeanBermudanBhutaneseBlackfeetBolivianBrazilianBritishBritish West IndianBulgarianBurmeseCajunCambodianCanadianCape VerdeanCarpatho RusynCelticCentral AmericanCentral American IndianCherokeeCheyenneChickasawChileanChineseChippewaChoctawColombianColvilleComancheCosta RicanCreeCreekCroatianCrowCubanCypriotCzechCzechoslovakianDanishDelawareDominicanDutchDutch West IndianEastern EuropeanEcuadorianEgyptianEnglishEstonianEthiopianEuropeanFijianFilipinoFinnishFrenchFrench American IndianFrench CanadianGermanGerman RussianGhanaianGreekGuamanian/ChamorroGuatemalanGuyaneseHaitianHmongHonduranHopiHoumaHungarianIcelanderIndian (Asian)IndonesianInupiatIranianIraqiIrishIroquoisIsraeliItalianJamaicanJapaneseJordanianKenyanKiowaKoreanLaotianLatvianLebaneseLiberianLithuanianLumbeeLuxembourgerMacedonianMalaysianMalteseMarshalleseMenomineeMexicanMexican American IndianMongolianMoroccanNative HawaiianNavajoNepaleseNew ZealanderNicaraguanNigerianNorthern EuropeanNorwegianOkinawanOsageOttawaPaiutePakistaniPalestinianPanamanianParaguayanPennsylvania GermanPeruvianPimaPolishPortuguesePotawatomiPuebloPuerto RicanPuget Sound SalishRomanianRussianSalvadoranSamoanScandinavianScotch-IrishScottishSeminoleSenegaleseSerbianShoshoneSierra LeoneanSiouxSlavicSlovakSloveneSomaliSouth AfricanSouth AmericanSouth American IndianSoviet UnionSpaniardSpanishSpanish AmericanSpanish American IndianSri LankanSubsaharan AfricanSudaneseSwedishSwissSyrianTaiwaneseThaiTlingit-HaidaTohono O'OdhamTonganTrinidadian and TobagonianTsimshianTurkishU.S. Virgin IslanderUgandanUkrainianUruguayanUteVenezuelanVietnameseWelshWest IndianYakamaYaquiYugoslavianYumanYup'ikZimbabwean
Immigration
NonimmigrantsImmigrantsAfghanistanAfricaAlbaniaArgentinaArmeniaAsiaAustraliaAustriaBahamasBangladeshBarbadosBelarusBelgiumBelizeBoliviaBosnia and HerzegovinaBrazilBulgariaBurma/MyanmarCabo VerdeCambodiaCameroonCanadaCaribbeanCentral AmericaChileChinaColombiaCongoCosta RicaCroatiaCubaCzechoslovakiaDenmarkDominicaDominican RepublicEastern AfricaEastern AsiaEastern EuropeEcuadorEgyptEl SalvadorEnglandEritreaEthiopiaEuropeFijiFranceGermanyGhanaGreeceGrenadaGuatemalaGuyanaHaitiHondurasHong KongHungaryIndiaIndonesiaIranIraqIrelandIsraelItalyJamaicaJapanJordanKazakhstanKenyaKoreaKuwaitLaosLatin AmericaLatviaLebanonLiberiaLithuaniaMalaysiaMexicoMiddle AfricaMoldovaMoroccoNepalNetherlandsNicaraguaNigeriaNorth AmericaNorth MacedoniaNorthern AfricaNorthern EuropeNorwayOceaniaPakistanPanamaPeruPhilippinesPolandPortugalRomaniaRussiaSaudi ArabiaScotlandSenegalSerbiaSierra LeoneSingaporeSomaliaSouth AfricaSouth AmericaSouth Central AsiaSouth Eastern AsiaSouthern EuropeSpainSri LankaSt. Vincent and the GrenadinesSudanSwedenSwitzerlandSyriaTaiwanThailandTrinidad and TobagoTurkeyUgandaUkraineUruguayUzbekistanVenezuelaVietnamWest IndiesWestern AfricaWestern AsiaWestern EuropeYemenZaireZimbabweAzores
Immigrants from Micronesia
Race
Ancestry
AfghanAfricanAlaska NativeAlaskan AthabascanAlbanianAleutAlsatianAmericanApacheArabArapahoArgentineanArmenianAssyrian/Chaldean/SyriacAustralianAustrianBahamianBangladeshiBarbadianBasqueBelgianBelizeanBermudanBhutaneseBlackfeetBolivianBrazilianBritishBritish West IndianBulgarianBurmeseCajunCambodianCanadianCape VerdeanCarpatho RusynCelticCentral AmericanCentral American IndianCherokeeCheyenneChickasawChileanChineseChippewaChoctawColombianColvilleComancheCosta RicanCreeCreekCroatianCrowCubanCypriotCzechCzechoslovakianDanishDelawareDominicanDutchDutch West IndianEastern EuropeanEcuadorianEgyptianEnglishEstonianEthiopianEuropeanFijianFilipinoFinnishFrenchFrench American IndianFrench CanadianGermanGerman RussianGhanaianGreekGuamanian/ChamorroGuatemalanGuyaneseHaitianHmongHonduranHopiHoumaHungarianIcelanderIndian (Asian)IndonesianInupiatIranianIraqiIrishIroquoisIsraeliItalianJamaicanJapaneseJordanianKenyanKiowaKoreanLaotianLatvianLebaneseLiberianLithuanianLumbeeLuxembourgerMacedonianMalaysianMalteseMarshalleseMenomineeMexicanMexican American IndianMongolianMoroccanNative HawaiianNavajoNepaleseNew ZealanderNicaraguanNigerianNorthern EuropeanNorwegianOkinawanOsageOttawaPaiutePakistaniPalestinianPanamanianParaguayanPennsylvania GermanPeruvianPimaPolishPortuguesePotawatomiPuebloPuerto RicanPuget Sound SalishRomanianRussianSalvadoranSamoanScandinavianScotch-IrishScottishSeminoleSenegaleseSerbianShoshoneSierra LeoneanSiouxSlavicSlovakSloveneSomaliSouth AfricanSouth AmericanSouth American IndianSoviet UnionSpaniardSpanishSpanish AmericanSpanish American IndianSri LankanSubsaharan AfricanSudaneseSwedishSwissSyrianTaiwaneseThaiTlingit-HaidaTohono O'OdhamTonganTrinidadian and TobagonianTsimshianTurkishU.S. Virgin IslanderUgandanUkrainianUruguayanUteVenezuelanVietnameseWelshWest IndianYakamaYaquiYugoslavianYumanYup'ikZimbabwean
Immigration
NonimmigrantsImmigrantsAfghanistanAfricaAlbaniaArgentinaArmeniaAsiaAustraliaAustriaBahamasBangladeshBarbadosBelarusBelgiumBelizeBoliviaBosnia and HerzegovinaBrazilBulgariaBurma/MyanmarCabo VerdeCambodiaCameroonCanadaCaribbeanCentral AmericaChileChinaColombiaCongoCosta RicaCroatiaCubaCzechoslovakiaDenmarkDominicaDominican RepublicEastern AfricaEastern AsiaEastern EuropeEcuadorEgyptEl SalvadorEnglandEritreaEthiopiaEuropeFijiFranceGermanyGhanaGreeceGrenadaGuatemalaGuyanaHaitiHondurasHong KongHungaryIndiaIndonesiaIranIraqIrelandIsraelItalyJamaicaJapanJordanKazakhstanKenyaKoreaKuwaitLaosLatin AmericaLatviaLebanonLiberiaLithuaniaMalaysiaMexicoMicronesiaMiddle AfricaMoroccoNepalNetherlandsNicaraguaNigeriaNorth AmericaNorth MacedoniaNorthern AfricaNorthern EuropeNorwayOceaniaPakistanPanamaPeruPhilippinesPolandPortugalRomaniaRussiaSaudi ArabiaScotlandSenegalSerbiaSierra LeoneSingaporeSomaliaSouth AfricaSouth AmericaSouth Central AsiaSouth Eastern AsiaSouthern EuropeSpainSri LankaSt. Vincent and the GrenadinesSudanSwedenSwitzerlandSyriaTaiwanThailandTrinidad and TobagoTurkeyUgandaUkraineUruguayUzbekistanVenezuelaVietnamWest IndiesWestern AfricaWestern AsiaWestern EuropeYemenZaireZimbabweAzores
Disability Age Under 5
Income
Poverty
Unemployment
Labor Participation
Family Structure
Vehicle Availability
Education Level
Disability

Disability Age Under 5 Comparison

Immigrants from Moldova

Immigrants from Micronesia

Exceptional
Exceptional
1.1%
DISABILITY AGE UNDER 5
96.8/ 100
METRIC RATING
95th/ 347
METRIC RANK
1.0%
DISABILITY AGE UNDER 5
100.0/ 100
METRIC RATING
25th/ 347
METRIC RANK

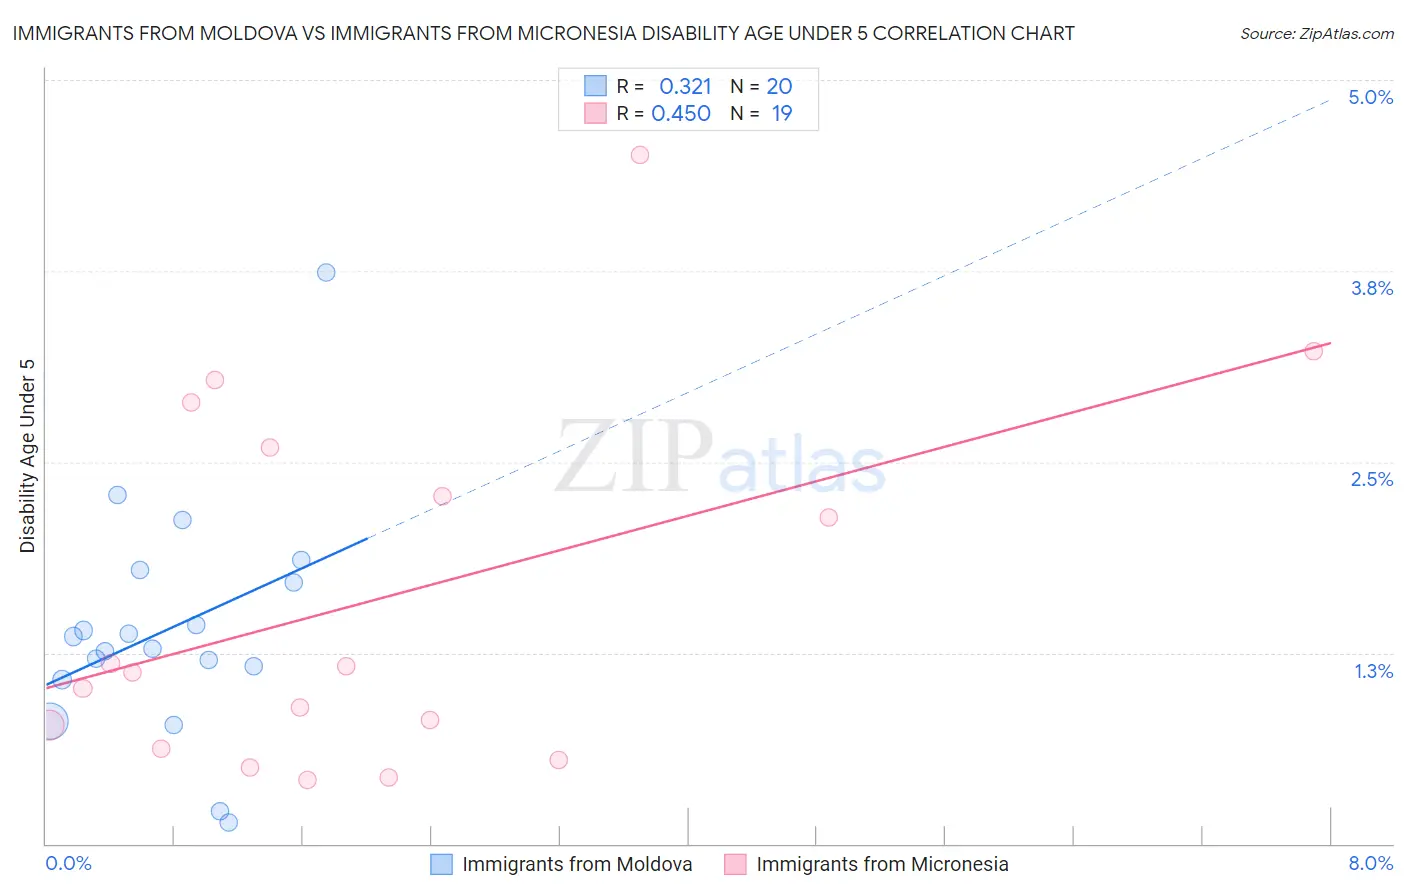
Immigrants from Moldova vs Immigrants from Micronesia Disability Age Under 5 Correlation Chart

The statistical analysis conducted on geographies consisting of 88,816,891 people shows a mild positive correlation between the proportion of Immigrants from Moldova and percentage of population with a disability under the age of 5 in the United States with a correlation coefficient (R) of 0.321 and weighted average of 1.1%. Similarly, the statistical analysis conducted on geographies consisting of 52,170,581 people shows a moderate positive correlation between the proportion of Immigrants from Micronesia and percentage of population with a disability under the age of 5 in the United States with a correlation coefficient (R) of 0.450 and weighted average of 1.0%, a difference of 13.9%.
Immigrants from Moldova vs Immigrants from Micronesia Disability Age Under 5

Disability Age Under 5 Correlation Summary

MeasurementImmigrants from MoldovaImmigrants from Micronesia
Minimum0.14%0.42%
Maximum3.7%4.5%
Range3.6%4.1%
Mean1.4%1.6%
Median1.3%1.1%
Interquartile 25% (IQ1)1.1%0.63%
Interquartile 75% (IQ3)1.8%2.6%
Interquartile Range (IQR)0.63%2.0%
Standard Deviation (Sample)0.77%1.2%
Standard Deviation (Population)0.75%1.2%

Similar Demographics by Disability Age Under 5

Demographics Similar to Immigrants from Moldova by Disability Age Under 5

In terms of disability age under 5, the demographic groups most similar to Immigrants from Moldova are Sri Lankan (1.1%, a difference of 0.050%), Mongolian (1.1%, a difference of 0.10%), Spanish American (1.1%, a difference of 0.11%), Immigrants from Cuba (1.1%, a difference of 0.14%), and Immigrants from Iraq (1.1%, a difference of 0.20%).
DemographicsRating | RankDisability Age Under 5
Immigrants | Dominican Republic
97.5
/100
|
#88
Exceptional
1.1%
Ethiopians
97.2
/100
|
#89
Exceptional
1.1%
Chinese
97.2
/100
|
#90
Exceptional
1.1%
Albanians
97.2
/100
|
#91
Exceptional
1.1%
Immigrants | Cuba
97.0
/100
|
#92
Exceptional
1.1%
Spanish Americans
96.9
/100
|
#93
Exceptional
1.1%
Sri Lankans
96.8
/100
|
#94
Exceptional
1.1%
Immigrants | Moldova
96.8
/100
|
#95
Exceptional
1.1%
Mongolians
96.6
/100
|
#96
Exceptional
1.1%
Immigrants | Iraq
96.5
/100
|
#97
Exceptional
1.1%
Immigrants | South Eastern Asia
96.5
/100
|
#98
Exceptional
1.1%
Dominicans
96.3
/100
|
#99
Exceptional
1.1%
Nicaraguans
96.3
/100
|
#100
Exceptional
1.1%
Immigrants | Uganda
96.1
/100
|
#101
Exceptional
1.1%
Immigrants | Morocco
96.0
/100
|
#102
Exceptional
1.2%

Demographics Similar to Immigrants from Micronesia by Disability Age Under 5

In terms of disability age under 5, the demographic groups most similar to Immigrants from Micronesia are Immigrants from Taiwan (1.0%, a difference of 0.12%), Indian (Asian) (1.0%, a difference of 0.31%), Yakama (1.00%, a difference of 0.59%), Immigrants from Iran (1.00%, a difference of 0.67%), and Guyanese (1.0%, a difference of 0.97%).
DemographicsRating | RankDisability Age Under 5
Immigrants | Barbados
100.0
/100
|
#18
Exceptional
0.97%
Puget Sound Salish
100.0
/100
|
#19
Exceptional
0.97%
Nepalese
100.0
/100
|
#20
Exceptional
0.97%
British West Indians
100.0
/100
|
#21
Exceptional
0.99%
Immigrants | Iran
100.0
/100
|
#22
Exceptional
1.00%
Yakama
100.0
/100
|
#23
Exceptional
1.00%
Indians (Asian)
100.0
/100
|
#24
Exceptional
1.0%
Immigrants | Micronesia
100.0
/100
|
#25
Exceptional
1.0%
Immigrants | Taiwan
100.0
/100
|
#26
Exceptional
1.0%
Guyanese
100.0
/100
|
#27
Exceptional
1.0%
Immigrants | Eastern Asia
100.0
/100
|
#28
Exceptional
1.0%
Immigrants | Belarus
100.0
/100
|
#29
Exceptional
1.0%
Immigrants | South Central Asia
99.9
/100
|
#30
Exceptional
1.0%
Armenians
99.9
/100
|
#31
Exceptional
1.0%
Iranians
99.9
/100
|
#32
Exceptional
1.0%