Immigrants from Middle Africa vs Haitian Disability Age 65 to 74
COMPARE
Immigrants from Middle Africa
Haitian
Disability Age 65 to 74
Disability Age 65 to 74 Comparison
Immigrants from Middle Africa
Haitians
24.1%
DISABILITY AGE 65 TO 74
8.9/ 100
METRIC RATING
223rd/ 347
METRIC RANK
23.4%
DISABILITY AGE 65 TO 74
42.4/ 100
METRIC RATING
185th/ 347
METRIC RANK
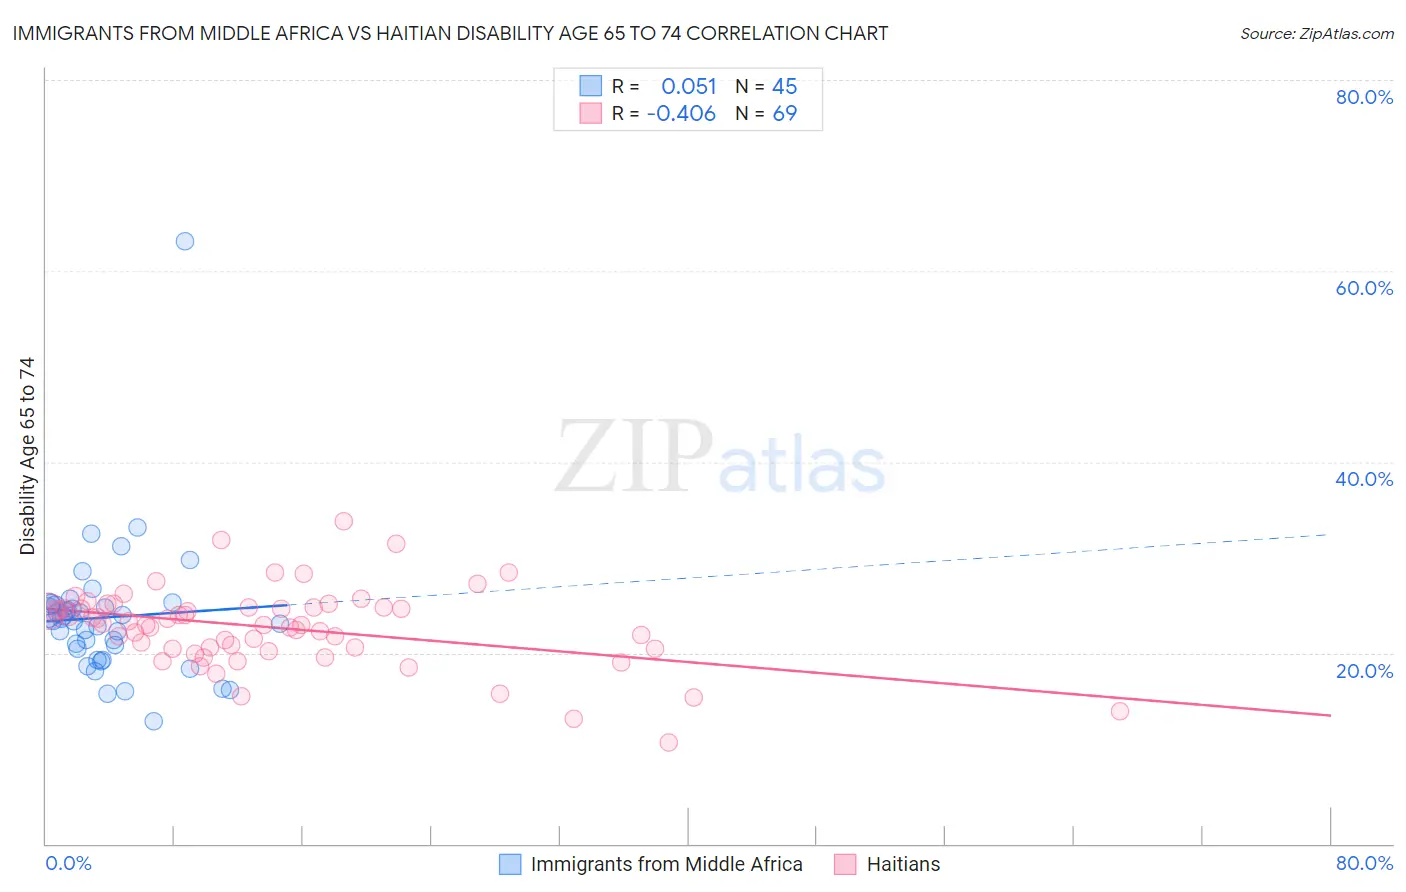
Immigrants from Middle Africa vs Haitian Disability Age 65 to 74 Correlation Chart
The statistical analysis conducted on geographies consisting of 202,480,868 people shows a slight positive correlation between the proportion of Immigrants from Middle Africa and percentage of population with a disability between the ages 65 and 75 in the United States with a correlation coefficient (R) of 0.051 and weighted average of 24.1%. Similarly, the statistical analysis conducted on geographies consisting of 287,213,358 people shows a moderate negative correlation between the proportion of Haitians and percentage of population with a disability between the ages 65 and 75 in the United States with a correlation coefficient (R) of -0.406 and weighted average of 23.4%, a difference of 2.9%.
Disability Age 65 to 74 Correlation Summary
| Measurement | Immigrants from Middle Africa | Haitian |
| Minimum | 12.9% | 10.6% |
| Maximum | 63.1% | 33.7% |
| Range | 50.2% | 23.1% |
| Mean | 23.7% | 22.6% |
| Median | 23.4% | 23.0% |
| Interquartile 25% (IQ1) | 19.9% | 20.4% |
| Interquartile 75% (IQ3) | 25.0% | 24.7% |
| Interquartile Range (IQR) | 5.2% | 4.3% |
| Standard Deviation (Sample) | 7.4% | 4.1% |
| Standard Deviation (Population) | 7.3% | 4.1% |
Similar Demographics by Disability Age 65 to 74
Demographics Similar to Immigrants from Middle Africa by Disability Age 65 to 74
In terms of disability age 65 to 74, the demographic groups most similar to Immigrants from Middle Africa are Immigrants from Panama (24.1%, a difference of 0.050%), Native Hawaiian (24.1%, a difference of 0.070%), Bermudan (24.2%, a difference of 0.13%), Immigrants from Nicaragua (24.1%, a difference of 0.14%), and Iraqi (24.2%, a difference of 0.14%).
| Demographics | Rating | Rank | Disability Age 65 to 74 |
| Jamaicans | 12.2 /100 | #216 | Poor 24.0% |
| Immigrants | Portugal | 11.7 /100 | #217 | Poor 24.0% |
| Immigrants | Nigeria | 11.7 /100 | #218 | Poor 24.0% |
| Immigrants | Burma/Myanmar | 11.6 /100 | #219 | Poor 24.0% |
| Ghanaians | 10.4 /100 | #220 | Poor 24.1% |
| Immigrants | Nicaragua | 9.8 /100 | #221 | Tragic 24.1% |
| Native Hawaiians | 9.3 /100 | #222 | Tragic 24.1% |
| Immigrants | Middle Africa | 8.9 /100 | #223 | Tragic 24.1% |
| Immigrants | Panama | 8.6 /100 | #224 | Tragic 24.1% |
| Bermudans | 8.2 /100 | #225 | Tragic 24.2% |
| Iraqis | 8.1 /100 | #226 | Tragic 24.2% |
| Nigerians | 7.8 /100 | #227 | Tragic 24.2% |
| Whites/Caucasians | 6.6 /100 | #228 | Tragic 24.2% |
| Celtics | 6.4 /100 | #229 | Tragic 24.2% |
| Barbadians | 6.0 /100 | #230 | Tragic 24.3% |
Demographics Similar to Haitians by Disability Age 65 to 74
In terms of disability age 65 to 74, the demographic groups most similar to Haitians are Immigrants from Germany (23.4%, a difference of 0.010%), Immigrants from Eastern Africa (23.4%, a difference of 0.030%), Irish (23.4%, a difference of 0.12%), Assyrian/Chaldean/Syriac (23.4%, a difference of 0.17%), and Scandinavian (23.4%, a difference of 0.19%).
| Demographics | Rating | Rank | Disability Age 65 to 74 |
| Guyanese | 45.8 /100 | #178 | Average 23.4% |
| Immigrants | Sierra Leone | 45.8 /100 | #179 | Average 23.4% |
| Scandinavians | 45.6 /100 | #180 | Average 23.4% |
| Assyrians/Chaldeans/Syriacs | 45.3 /100 | #181 | Average 23.4% |
| Irish | 44.4 /100 | #182 | Average 23.4% |
| Immigrants | Eastern Africa | 42.8 /100 | #183 | Average 23.4% |
| Immigrants | Germany | 42.5 /100 | #184 | Average 23.4% |
| Haitians | 42.4 /100 | #185 | Average 23.4% |
| Basques | 38.4 /100 | #186 | Fair 23.5% |
| Portuguese | 37.8 /100 | #187 | Fair 23.5% |
| Immigrants | Cuba | 34.0 /100 | #188 | Fair 23.6% |
| Scottish | 33.1 /100 | #189 | Fair 23.6% |
| Immigrants | Guyana | 31.2 /100 | #190 | Fair 23.6% |
| Immigrants | Bangladesh | 30.2 /100 | #191 | Fair 23.6% |
| Ecuadorians | 29.7 /100 | #192 | Fair 23.6% |