Immigrants from Iraq vs Yugoslavian Hearing Disability
COMPARE
Immigrants from Iraq
Yugoslavian
Hearing Disability
Hearing Disability Comparison
Immigrants from Iraq
Yugoslavians
3.1%
HEARING DISABILITY
10.5/ 100
METRIC RATING
213th/ 347
METRIC RANK
3.3%
HEARING DISABILITY
1.0/ 100
METRIC RATING
242nd/ 347
METRIC RANK
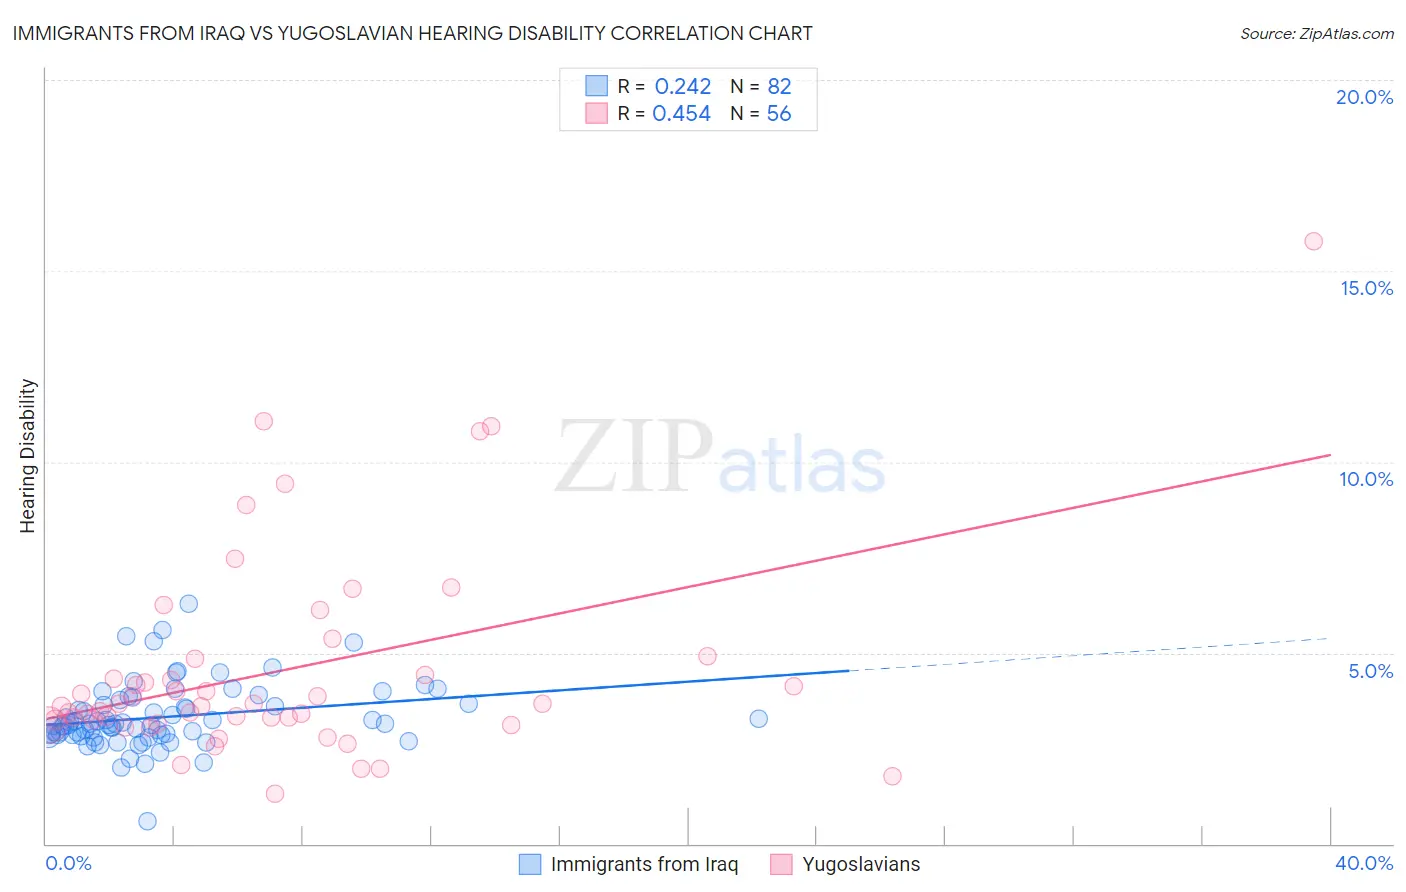
Immigrants from Iraq vs Yugoslavian Hearing Disability Correlation Chart
The statistical analysis conducted on geographies consisting of 194,749,544 people shows a weak positive correlation between the proportion of Immigrants from Iraq and percentage of population with hearing disability in the United States with a correlation coefficient (R) of 0.242 and weighted average of 3.1%. Similarly, the statistical analysis conducted on geographies consisting of 285,663,811 people shows a moderate positive correlation between the proportion of Yugoslavians and percentage of population with hearing disability in the United States with a correlation coefficient (R) of 0.454 and weighted average of 3.3%, a difference of 5.4%.
Hearing Disability Correlation Summary
| Measurement | Immigrants from Iraq | Yugoslavian |
| Minimum | 0.59% | 1.3% |
| Maximum | 6.3% | 15.8% |
| Range | 5.7% | 14.5% |
| Mean | 3.3% | 4.5% |
| Median | 3.1% | 3.6% |
| Interquartile 25% (IQ1) | 2.8% | 3.2% |
| Interquartile 75% (IQ3) | 3.6% | 4.6% |
| Interquartile Range (IQR) | 0.81% | 1.5% |
| Standard Deviation (Sample) | 0.86% | 2.7% |
| Standard Deviation (Population) | 0.86% | 2.7% |
Similar Demographics by Hearing Disability
Demographics Similar to Immigrants from Iraq by Hearing Disability
In terms of hearing disability, the demographic groups most similar to Immigrants from Iraq are Pakistani (3.1%, a difference of 0.15%), Romanian (3.1%, a difference of 0.36%), Cape Verdean (3.1%, a difference of 0.39%), Immigrants from Hungary (3.1%, a difference of 0.44%), and Immigrants from Latvia (3.1%, a difference of 0.48%).
| Demographics | Rating | Rank | Hearing Disability |
| Eastern Europeans | 15.5 /100 | #206 | Poor 3.1% |
| Hispanics or Latinos | 15.1 /100 | #207 | Poor 3.1% |
| Immigrants | Latvia | 12.7 /100 | #208 | Poor 3.1% |
| Immigrants | Hungary | 12.5 /100 | #209 | Poor 3.1% |
| Cape Verdeans | 12.2 /100 | #210 | Poor 3.1% |
| Romanians | 12.1 /100 | #211 | Poor 3.1% |
| Pakistanis | 11.1 /100 | #212 | Poor 3.1% |
| Immigrants | Iraq | 10.5 /100 | #213 | Poor 3.1% |
| Australians | 8.1 /100 | #214 | Tragic 3.2% |
| Bangladeshis | 8.1 /100 | #215 | Tragic 3.2% |
| Immigrants | Norway | 7.3 /100 | #216 | Tragic 3.2% |
| Russians | 7.1 /100 | #217 | Tragic 3.2% |
| Immigrants | Northern Europe | 7.0 /100 | #218 | Tragic 3.2% |
| New Zealanders | 6.8 /100 | #219 | Tragic 3.2% |
| Malaysians | 6.6 /100 | #220 | Tragic 3.2% |
Demographics Similar to Yugoslavians by Hearing Disability
In terms of hearing disability, the demographic groups most similar to Yugoslavians are Samoan (3.3%, a difference of 0.11%), Immigrants from Western Europe (3.3%, a difference of 0.17%), Immigrants from Netherlands (3.3%, a difference of 0.18%), Assyrian/Chaldean/Syriac (3.3%, a difference of 0.24%), and Nepalese (3.3%, a difference of 0.36%).
| Demographics | Rating | Rank | Hearing Disability |
| Guamanians/Chamorros | 2.2 /100 | #235 | Tragic 3.3% |
| Serbians | 2.2 /100 | #236 | Tragic 3.3% |
| Immigrants | Austria | 1.8 /100 | #237 | Tragic 3.3% |
| German Russians | 1.8 /100 | #238 | Tragic 3.3% |
| Nepalese | 1.2 /100 | #239 | Tragic 3.3% |
| Immigrants | Netherlands | 1.1 /100 | #240 | Tragic 3.3% |
| Samoans | 1.1 /100 | #241 | Tragic 3.3% |
| Yugoslavians | 1.0 /100 | #242 | Tragic 3.3% |
| Immigrants | Western Europe | 1.0 /100 | #243 | Tragic 3.3% |
| Assyrians/Chaldeans/Syriacs | 0.9 /100 | #244 | Tragic 3.3% |
| Immigrants | Scotland | 0.8 /100 | #245 | Tragic 3.3% |
| Immigrants | England | 0.7 /100 | #246 | Tragic 3.3% |
| Lithuanians | 0.6 /100 | #247 | Tragic 3.4% |
| Austrians | 0.6 /100 | #248 | Tragic 3.4% |
| Italians | 0.4 /100 | #249 | Tragic 3.4% |