Immigrants from Malaysia vs Russian Vision Disability
COMPARE
Immigrants from Malaysia
Russian
Vision Disability
Vision Disability Comparison
Immigrants from Malaysia
Russians
1.9%
VISION DISABILITY
99.9/ 100
METRIC RATING
28th/ 347
METRIC RANK
2.0%
VISION DISABILITY
98.6/ 100
METRIC RATING
69th/ 347
METRIC RANK
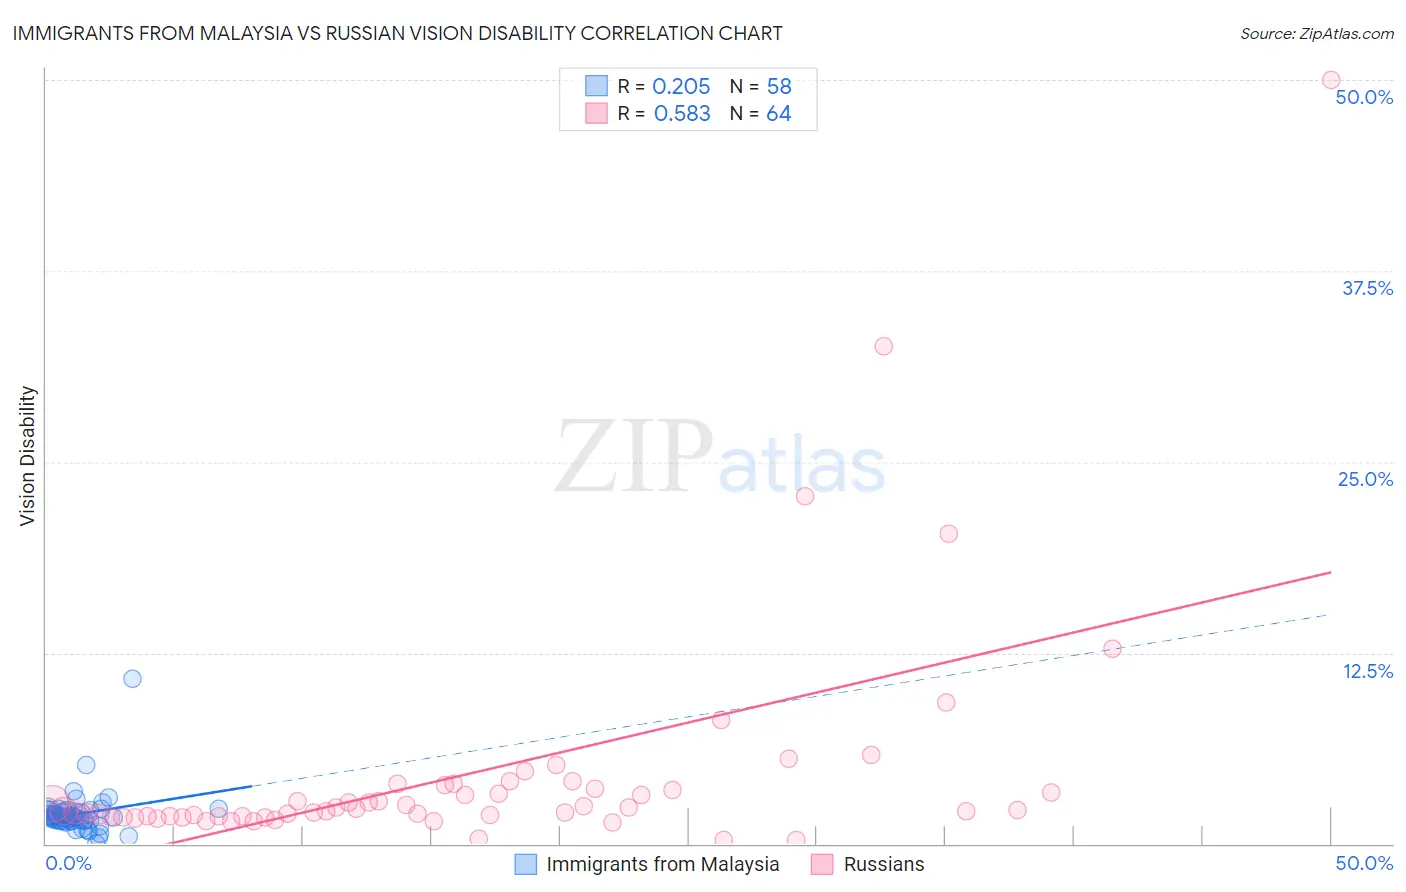
Immigrants from Malaysia vs Russian Vision Disability Correlation Chart
The statistical analysis conducted on geographies consisting of 197,931,356 people shows a weak positive correlation between the proportion of Immigrants from Malaysia and percentage of population with vision disability in the United States with a correlation coefficient (R) of 0.205 and weighted average of 1.9%. Similarly, the statistical analysis conducted on geographies consisting of 511,148,193 people shows a substantial positive correlation between the proportion of Russians and percentage of population with vision disability in the United States with a correlation coefficient (R) of 0.583 and weighted average of 2.0%, a difference of 4.8%.
Vision Disability Correlation Summary
| Measurement | Immigrants from Malaysia | Russian |
| Minimum | 0.037% | 0.22% |
| Maximum | 10.8% | 50.0% |
| Range | 10.8% | 49.8% |
| Mean | 1.9% | 4.6% |
| Median | 1.7% | 2.2% |
| Interquartile 25% (IQ1) | 1.5% | 1.8% |
| Interquartile 75% (IQ3) | 2.1% | 3.7% |
| Interquartile Range (IQR) | 0.58% | 1.9% |
| Standard Deviation (Sample) | 1.4% | 7.8% |
| Standard Deviation (Population) | 1.4% | 7.8% |
Similar Demographics by Vision Disability
Demographics Similar to Immigrants from Malaysia by Vision Disability
In terms of vision disability, the demographic groups most similar to Immigrants from Malaysia are Taiwanese (1.9%, a difference of 0.020%), Egyptian (1.9%, a difference of 0.070%), Immigrants from Nepal (1.9%, a difference of 0.11%), Mongolian (1.9%, a difference of 0.27%), and Immigrants from Japan (1.9%, a difference of 0.36%).
| Demographics | Rating | Rank | Vision Disability |
| Turks | 100.0 /100 | #21 | Exceptional 1.9% |
| Immigrants | Pakistan | 100.0 /100 | #22 | Exceptional 1.9% |
| Immigrants | Asia | 99.9 /100 | #23 | Exceptional 1.9% |
| Immigrants | Lithuania | 99.9 /100 | #24 | Exceptional 1.9% |
| Bulgarians | 99.9 /100 | #25 | Exceptional 1.9% |
| Immigrants | Japan | 99.9 /100 | #26 | Exceptional 1.9% |
| Taiwanese | 99.9 /100 | #27 | Exceptional 1.9% |
| Immigrants | Malaysia | 99.9 /100 | #28 | Exceptional 1.9% |
| Egyptians | 99.9 /100 | #29 | Exceptional 1.9% |
| Immigrants | Nepal | 99.9 /100 | #30 | Exceptional 1.9% |
| Mongolians | 99.9 /100 | #31 | Exceptional 1.9% |
| Luxembourgers | 99.9 /100 | #32 | Exceptional 1.9% |
| Immigrants | Egypt | 99.9 /100 | #33 | Exceptional 1.9% |
| Immigrants | Turkey | 99.8 /100 | #34 | Exceptional 1.9% |
| Immigrants | Australia | 99.8 /100 | #35 | Exceptional 1.9% |
Demographics Similar to Russians by Vision Disability
In terms of vision disability, the demographic groups most similar to Russians are Immigrants from Kazakhstan (2.0%, a difference of 0.020%), Immigrants from Northern Europe (2.0%, a difference of 0.030%), Immigrants from France (2.0%, a difference of 0.080%), Immigrants from Czechoslovakia (2.0%, a difference of 0.17%), and Immigrants from Northern Africa (2.0%, a difference of 0.27%).
| Demographics | Rating | Rank | Vision Disability |
| Immigrants | Russia | 99.1 /100 | #62 | Exceptional 2.0% |
| Armenians | 99.0 /100 | #63 | Exceptional 2.0% |
| Immigrants | Greece | 99.0 /100 | #64 | Exceptional 2.0% |
| Maltese | 98.9 /100 | #65 | Exceptional 2.0% |
| Immigrants | Argentina | 98.9 /100 | #66 | Exceptional 2.0% |
| Immigrants | Northern Africa | 98.8 /100 | #67 | Exceptional 2.0% |
| Immigrants | Czechoslovakia | 98.7 /100 | #68 | Exceptional 2.0% |
| Russians | 98.6 /100 | #69 | Exceptional 2.0% |
| Immigrants | Kazakhstan | 98.6 /100 | #70 | Exceptional 2.0% |
| Immigrants | Northern Europe | 98.6 /100 | #71 | Exceptional 2.0% |
| Immigrants | France | 98.5 /100 | #72 | Exceptional 2.0% |
| Immigrants | Eritrea | 98.4 /100 | #73 | Exceptional 2.0% |
| Palestinians | 98.3 /100 | #74 | Exceptional 2.0% |
| Immigrants | North Macedonia | 98.3 /100 | #75 | Exceptional 2.0% |
| Paraguayans | 98.3 /100 | #76 | Exceptional 2.0% |