Immigrants from Netherlands vs Russian Vision Disability
COMPARE
Immigrants from Netherlands
Russian
Vision Disability
Vision Disability Comparison
Immigrants from Netherlands
Russians
2.1%
VISION DISABILITY
84.2/ 100
METRIC RATING
140th/ 347
METRIC RANK
2.0%
VISION DISABILITY
98.6/ 100
METRIC RATING
69th/ 347
METRIC RANK
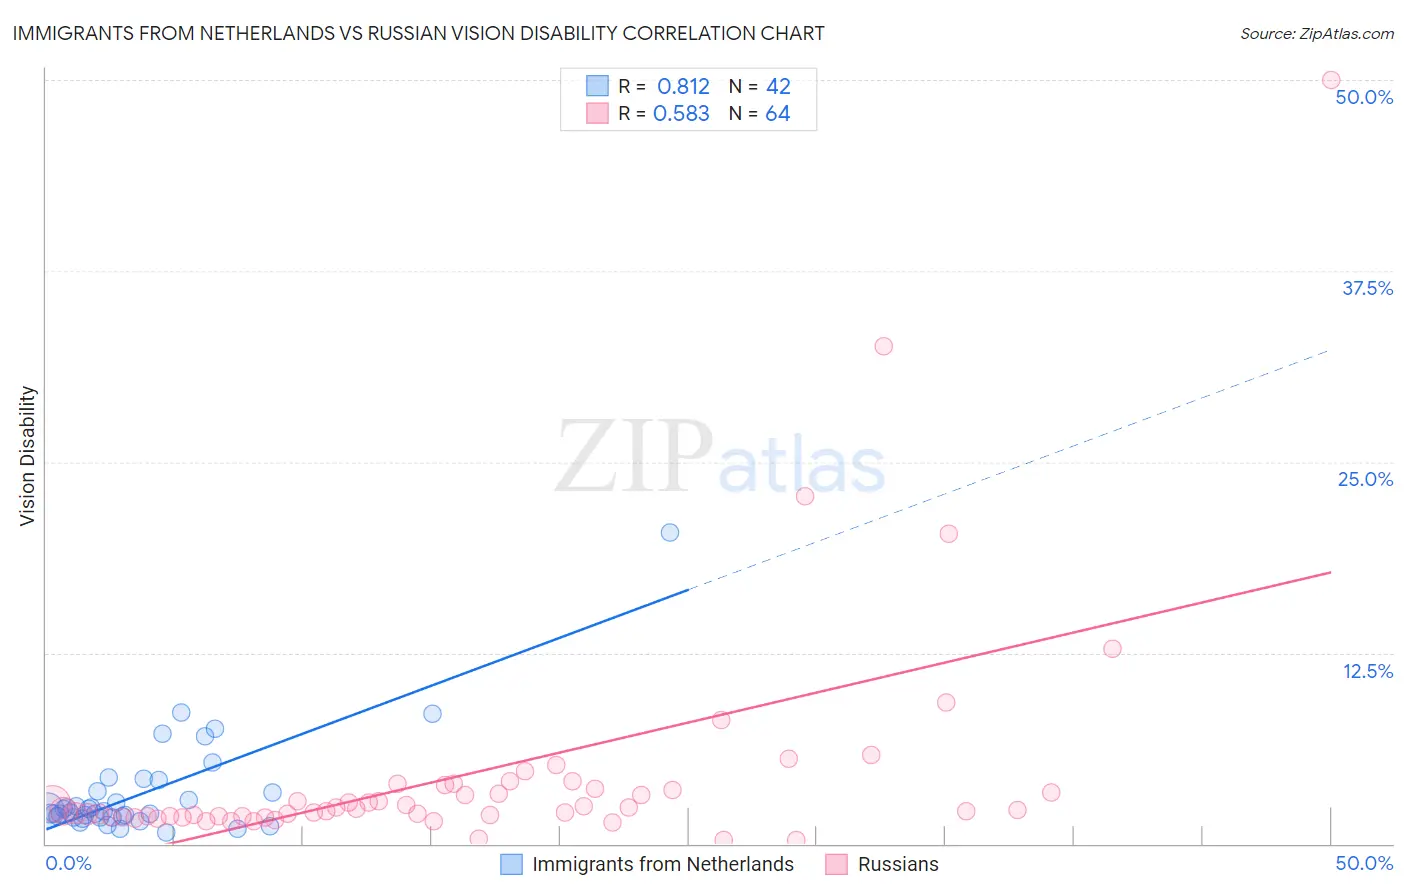
Immigrants from Netherlands vs Russian Vision Disability Correlation Chart
The statistical analysis conducted on geographies consisting of 237,808,259 people shows a very strong positive correlation between the proportion of Immigrants from Netherlands and percentage of population with vision disability in the United States with a correlation coefficient (R) of 0.812 and weighted average of 2.1%. Similarly, the statistical analysis conducted on geographies consisting of 511,148,193 people shows a substantial positive correlation between the proportion of Russians and percentage of population with vision disability in the United States with a correlation coefficient (R) of 0.583 and weighted average of 2.0%, a difference of 4.4%.
Vision Disability Correlation Summary
| Measurement | Immigrants from Netherlands | Russian |
| Minimum | 0.76% | 0.22% |
| Maximum | 20.4% | 50.0% |
| Range | 19.6% | 49.8% |
| Mean | 3.3% | 4.6% |
| Median | 2.1% | 2.2% |
| Interquartile 25% (IQ1) | 1.8% | 1.8% |
| Interquartile 75% (IQ3) | 3.5% | 3.7% |
| Interquartile Range (IQR) | 1.7% | 1.9% |
| Standard Deviation (Sample) | 3.4% | 7.8% |
| Standard Deviation (Population) | 3.3% | 7.8% |
Similar Demographics by Vision Disability
Demographics Similar to Immigrants from Netherlands by Vision Disability
In terms of vision disability, the demographic groups most similar to Immigrants from Netherlands are Sierra Leonean (2.1%, a difference of 0.010%), Immigrants from Morocco (2.1%, a difference of 0.13%), South American (2.1%, a difference of 0.16%), Immigrants from Sierra Leone (2.1%, a difference of 0.16%), and Ukrainian (2.1%, a difference of 0.26%).
| Demographics | Rating | Rank | Vision Disability |
| Syrians | 87.5 /100 | #133 | Excellent 2.1% |
| Venezuelans | 87.2 /100 | #134 | Excellent 2.1% |
| Vietnamese | 86.7 /100 | #135 | Excellent 2.1% |
| Czechs | 86.3 /100 | #136 | Excellent 2.1% |
| Immigrants | South Eastern Asia | 86.3 /100 | #137 | Excellent 2.1% |
| Arabs | 86.3 /100 | #138 | Excellent 2.1% |
| Immigrants | Morocco | 85.2 /100 | #139 | Excellent 2.1% |
| Immigrants | Netherlands | 84.2 /100 | #140 | Excellent 2.1% |
| Sierra Leoneans | 84.1 /100 | #141 | Excellent 2.1% |
| South Americans | 82.8 /100 | #142 | Excellent 2.1% |
| Immigrants | Sierra Leone | 82.8 /100 | #143 | Excellent 2.1% |
| Ukrainians | 81.9 /100 | #144 | Excellent 2.1% |
| Immigrants | Bosnia and Herzegovina | 81.5 /100 | #145 | Excellent 2.1% |
| Italians | 79.7 /100 | #146 | Good 2.1% |
| Immigrants | Sudan | 78.4 /100 | #147 | Good 2.1% |
Demographics Similar to Russians by Vision Disability
In terms of vision disability, the demographic groups most similar to Russians are Immigrants from Kazakhstan (2.0%, a difference of 0.020%), Immigrants from Northern Europe (2.0%, a difference of 0.030%), Immigrants from France (2.0%, a difference of 0.080%), Immigrants from Czechoslovakia (2.0%, a difference of 0.17%), and Immigrants from Northern Africa (2.0%, a difference of 0.27%).
| Demographics | Rating | Rank | Vision Disability |
| Immigrants | Russia | 99.1 /100 | #62 | Exceptional 2.0% |
| Armenians | 99.0 /100 | #63 | Exceptional 2.0% |
| Immigrants | Greece | 99.0 /100 | #64 | Exceptional 2.0% |
| Maltese | 98.9 /100 | #65 | Exceptional 2.0% |
| Immigrants | Argentina | 98.9 /100 | #66 | Exceptional 2.0% |
| Immigrants | Northern Africa | 98.8 /100 | #67 | Exceptional 2.0% |
| Immigrants | Czechoslovakia | 98.7 /100 | #68 | Exceptional 2.0% |
| Russians | 98.6 /100 | #69 | Exceptional 2.0% |
| Immigrants | Kazakhstan | 98.6 /100 | #70 | Exceptional 2.0% |
| Immigrants | Northern Europe | 98.6 /100 | #71 | Exceptional 2.0% |
| Immigrants | France | 98.5 /100 | #72 | Exceptional 2.0% |
| Immigrants | Eritrea | 98.4 /100 | #73 | Exceptional 2.0% |
| Palestinians | 98.3 /100 | #74 | Exceptional 2.0% |
| Immigrants | North Macedonia | 98.3 /100 | #75 | Exceptional 2.0% |
| Paraguayans | 98.3 /100 | #76 | Exceptional 2.0% |