Immigrants from Malaysia vs Vietnamese Vision Disability
COMPARE
Immigrants from Malaysia
Vietnamese
Vision Disability
Vision Disability Comparison
Immigrants from Malaysia
Vietnamese
1.9%
VISION DISABILITY
99.9/ 100
METRIC RATING
28th/ 347
METRIC RANK
2.1%
VISION DISABILITY
86.7/ 100
METRIC RATING
135th/ 347
METRIC RANK
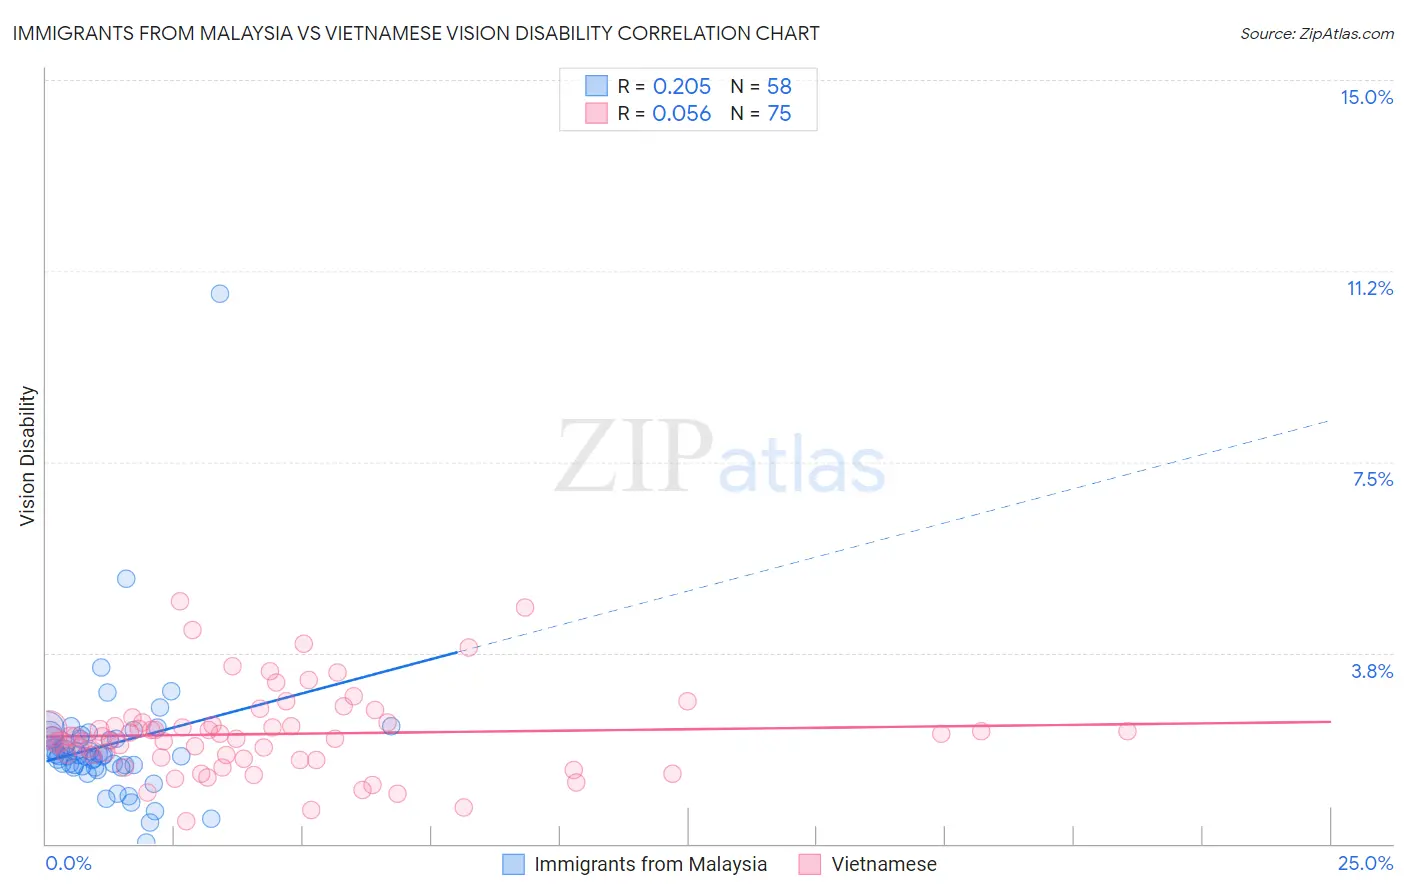
Immigrants from Malaysia vs Vietnamese Vision Disability Correlation Chart
The statistical analysis conducted on geographies consisting of 197,931,356 people shows a weak positive correlation between the proportion of Immigrants from Malaysia and percentage of population with vision disability in the United States with a correlation coefficient (R) of 0.205 and weighted average of 1.9%. Similarly, the statistical analysis conducted on geographies consisting of 170,695,405 people shows a slight positive correlation between the proportion of Vietnamese and percentage of population with vision disability in the United States with a correlation coefficient (R) of 0.056 and weighted average of 2.1%, a difference of 9.0%.
Vision Disability Correlation Summary
| Measurement | Immigrants from Malaysia | Vietnamese |
| Minimum | 0.037% | 0.44% |
| Maximum | 10.8% | 4.8% |
| Range | 10.8% | 4.3% |
| Mean | 1.9% | 2.2% |
| Median | 1.7% | 2.1% |
| Interquartile 25% (IQ1) | 1.5% | 1.7% |
| Interquartile 75% (IQ3) | 2.1% | 2.4% |
| Interquartile Range (IQR) | 0.58% | 0.72% |
| Standard Deviation (Sample) | 1.4% | 0.84% |
| Standard Deviation (Population) | 1.4% | 0.84% |
Similar Demographics by Vision Disability
Demographics Similar to Immigrants from Malaysia by Vision Disability
In terms of vision disability, the demographic groups most similar to Immigrants from Malaysia are Taiwanese (1.9%, a difference of 0.020%), Egyptian (1.9%, a difference of 0.070%), Immigrants from Nepal (1.9%, a difference of 0.11%), Mongolian (1.9%, a difference of 0.27%), and Immigrants from Japan (1.9%, a difference of 0.36%).
| Demographics | Rating | Rank | Vision Disability |
| Turks | 100.0 /100 | #21 | Exceptional 1.9% |
| Immigrants | Pakistan | 100.0 /100 | #22 | Exceptional 1.9% |
| Immigrants | Asia | 99.9 /100 | #23 | Exceptional 1.9% |
| Immigrants | Lithuania | 99.9 /100 | #24 | Exceptional 1.9% |
| Bulgarians | 99.9 /100 | #25 | Exceptional 1.9% |
| Immigrants | Japan | 99.9 /100 | #26 | Exceptional 1.9% |
| Taiwanese | 99.9 /100 | #27 | Exceptional 1.9% |
| Immigrants | Malaysia | 99.9 /100 | #28 | Exceptional 1.9% |
| Egyptians | 99.9 /100 | #29 | Exceptional 1.9% |
| Immigrants | Nepal | 99.9 /100 | #30 | Exceptional 1.9% |
| Mongolians | 99.9 /100 | #31 | Exceptional 1.9% |
| Luxembourgers | 99.9 /100 | #32 | Exceptional 1.9% |
| Immigrants | Egypt | 99.9 /100 | #33 | Exceptional 1.9% |
| Immigrants | Turkey | 99.8 /100 | #34 | Exceptional 1.9% |
| Immigrants | Australia | 99.8 /100 | #35 | Exceptional 1.9% |
Demographics Similar to Vietnamese by Vision Disability
In terms of vision disability, the demographic groups most similar to Vietnamese are Czech (2.1%, a difference of 0.050%), Immigrants from South Eastern Asia (2.1%, a difference of 0.050%), Arab (2.1%, a difference of 0.060%), Venezuelan (2.1%, a difference of 0.070%), and Syrian (2.1%, a difference of 0.12%).
| Demographics | Rating | Rank | Vision Disability |
| Immigrants | Chile | 89.0 /100 | #128 | Excellent 2.1% |
| Immigrants | Cameroon | 88.8 /100 | #129 | Excellent 2.1% |
| Immigrants | Kenya | 88.7 /100 | #130 | Excellent 2.1% |
| Immigrants | Hungary | 88.7 /100 | #131 | Excellent 2.1% |
| New Zealanders | 88.2 /100 | #132 | Excellent 2.1% |
| Syrians | 87.5 /100 | #133 | Excellent 2.1% |
| Venezuelans | 87.2 /100 | #134 | Excellent 2.1% |
| Vietnamese | 86.7 /100 | #135 | Excellent 2.1% |
| Czechs | 86.3 /100 | #136 | Excellent 2.1% |
| Immigrants | South Eastern Asia | 86.3 /100 | #137 | Excellent 2.1% |
| Arabs | 86.3 /100 | #138 | Excellent 2.1% |
| Immigrants | Morocco | 85.2 /100 | #139 | Excellent 2.1% |
| Immigrants | Netherlands | 84.2 /100 | #140 | Excellent 2.1% |
| Sierra Leoneans | 84.1 /100 | #141 | Excellent 2.1% |
| South Americans | 82.8 /100 | #142 | Excellent 2.1% |