Immigrants from Malaysia vs Canadian Vision Disability
COMPARE
Immigrants from Malaysia
Canadian
Vision Disability
Vision Disability Comparison
Immigrants from Malaysia
Canadians
1.9%
VISION DISABILITY
99.9/ 100
METRIC RATING
28th/ 347
METRIC RANK
2.2%
VISION DISABILITY
25.8/ 100
METRIC RATING
191st/ 347
METRIC RANK
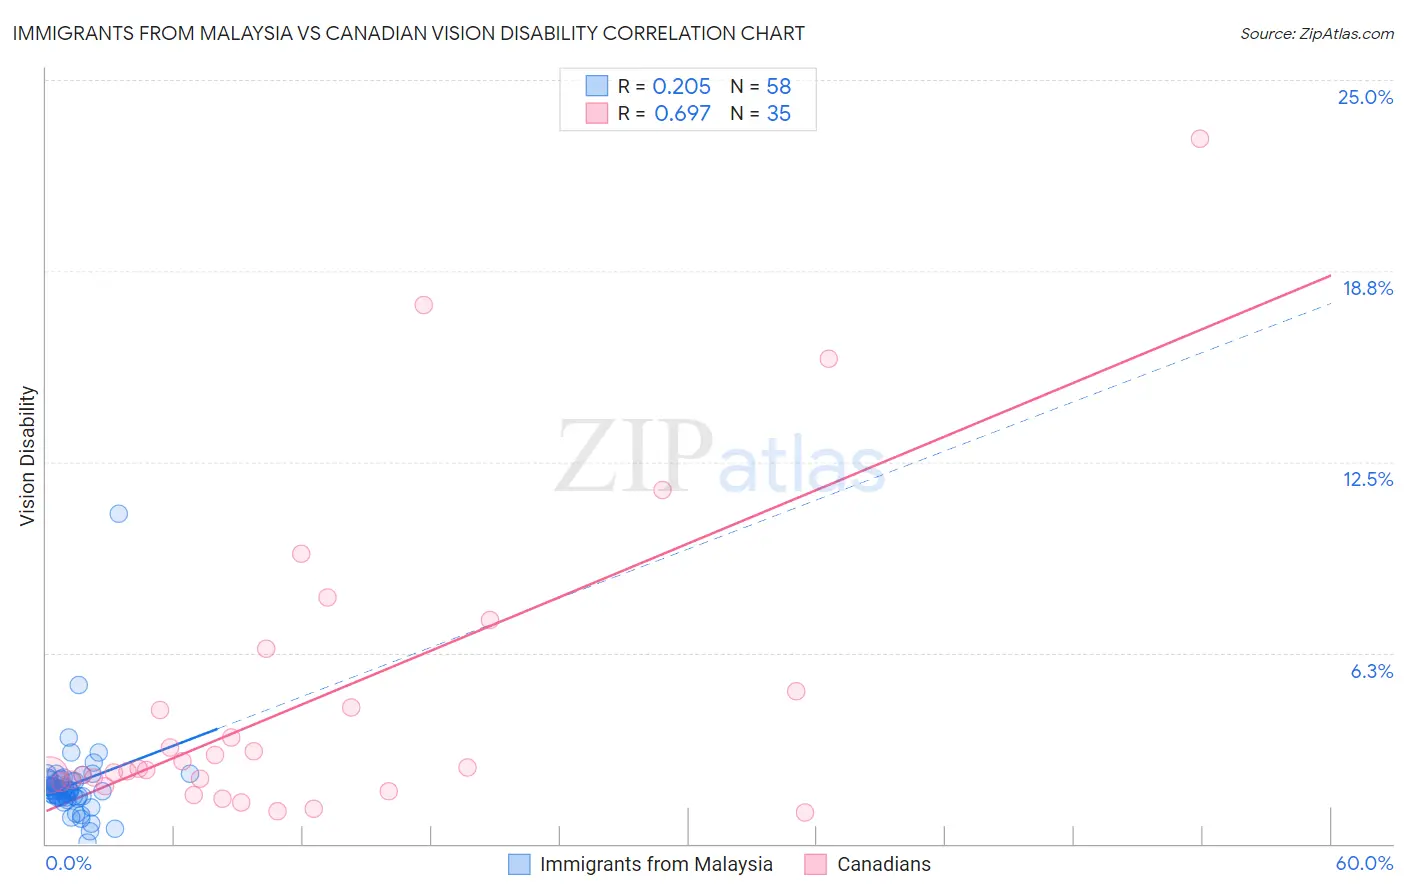
Immigrants from Malaysia vs Canadian Vision Disability Correlation Chart
The statistical analysis conducted on geographies consisting of 197,931,356 people shows a weak positive correlation between the proportion of Immigrants from Malaysia and percentage of population with vision disability in the United States with a correlation coefficient (R) of 0.205 and weighted average of 1.9%. Similarly, the statistical analysis conducted on geographies consisting of 437,069,200 people shows a significant positive correlation between the proportion of Canadians and percentage of population with vision disability in the United States with a correlation coefficient (R) of 0.697 and weighted average of 2.2%, a difference of 14.2%.
Vision Disability Correlation Summary
| Measurement | Immigrants from Malaysia | Canadian |
| Minimum | 0.037% | 1.0% |
| Maximum | 10.8% | 23.1% |
| Range | 10.8% | 22.0% |
| Mean | 1.9% | 4.7% |
| Median | 1.7% | 2.4% |
| Interquartile 25% (IQ1) | 1.5% | 2.0% |
| Interquartile 75% (IQ3) | 2.1% | 5.0% |
| Interquartile Range (IQR) | 0.58% | 3.0% |
| Standard Deviation (Sample) | 1.4% | 5.1% |
| Standard Deviation (Population) | 1.4% | 5.0% |
Similar Demographics by Vision Disability
Demographics Similar to Immigrants from Malaysia by Vision Disability
In terms of vision disability, the demographic groups most similar to Immigrants from Malaysia are Taiwanese (1.9%, a difference of 0.020%), Egyptian (1.9%, a difference of 0.070%), Immigrants from Nepal (1.9%, a difference of 0.11%), Mongolian (1.9%, a difference of 0.27%), and Immigrants from Japan (1.9%, a difference of 0.36%).
| Demographics | Rating | Rank | Vision Disability |
| Turks | 100.0 /100 | #21 | Exceptional 1.9% |
| Immigrants | Pakistan | 100.0 /100 | #22 | Exceptional 1.9% |
| Immigrants | Asia | 99.9 /100 | #23 | Exceptional 1.9% |
| Immigrants | Lithuania | 99.9 /100 | #24 | Exceptional 1.9% |
| Bulgarians | 99.9 /100 | #25 | Exceptional 1.9% |
| Immigrants | Japan | 99.9 /100 | #26 | Exceptional 1.9% |
| Taiwanese | 99.9 /100 | #27 | Exceptional 1.9% |
| Immigrants | Malaysia | 99.9 /100 | #28 | Exceptional 1.9% |
| Egyptians | 99.9 /100 | #29 | Exceptional 1.9% |
| Immigrants | Nepal | 99.9 /100 | #30 | Exceptional 1.9% |
| Mongolians | 99.9 /100 | #31 | Exceptional 1.9% |
| Luxembourgers | 99.9 /100 | #32 | Exceptional 1.9% |
| Immigrants | Egypt | 99.9 /100 | #33 | Exceptional 1.9% |
| Immigrants | Turkey | 99.8 /100 | #34 | Exceptional 1.9% |
| Immigrants | Australia | 99.8 /100 | #35 | Exceptional 1.9% |
Demographics Similar to Canadians by Vision Disability
In terms of vision disability, the demographic groups most similar to Canadians are European (2.2%, a difference of 0.010%), Immigrants from Costa Rica (2.2%, a difference of 0.020%), British (2.2%, a difference of 0.060%), Salvadoran (2.2%, a difference of 0.13%), and Immigrants from Barbados (2.2%, a difference of 0.15%).
| Demographics | Rating | Rank | Vision Disability |
| Moroccans | 35.4 /100 | #184 | Fair 2.2% |
| Immigrants | Middle Africa | 33.5 /100 | #185 | Fair 2.2% |
| Native Hawaiians | 33.3 /100 | #186 | Fair 2.2% |
| Immigrants | St. Vincent and the Grenadines | 30.3 /100 | #187 | Fair 2.2% |
| Guyanese | 28.9 /100 | #188 | Fair 2.2% |
| Salvadorans | 27.4 /100 | #189 | Fair 2.2% |
| Immigrants | Costa Rica | 26.1 /100 | #190 | Fair 2.2% |
| Canadians | 25.8 /100 | #191 | Fair 2.2% |
| Europeans | 25.7 /100 | #192 | Fair 2.2% |
| British | 25.1 /100 | #193 | Fair 2.2% |
| Immigrants | Barbados | 24.0 /100 | #194 | Fair 2.2% |
| Immigrants | Immigrants | 23.7 /100 | #195 | Fair 2.2% |
| Immigrants | Grenada | 23.1 /100 | #196 | Fair 2.2% |
| Ghanaians | 21.8 /100 | #197 | Fair 2.2% |
| Czechoslovakians | 21.6 /100 | #198 | Fair 2.2% |