Immigrants from Malaysia vs Australian Vision Disability
COMPARE
Immigrants from Malaysia
Australian
Vision Disability
Vision Disability Comparison
Immigrants from Malaysia
Australians
1.9%
VISION DISABILITY
99.9/ 100
METRIC RATING
28th/ 347
METRIC RANK
2.1%
VISION DISABILITY
95.9/ 100
METRIC RATING
95th/ 347
METRIC RANK
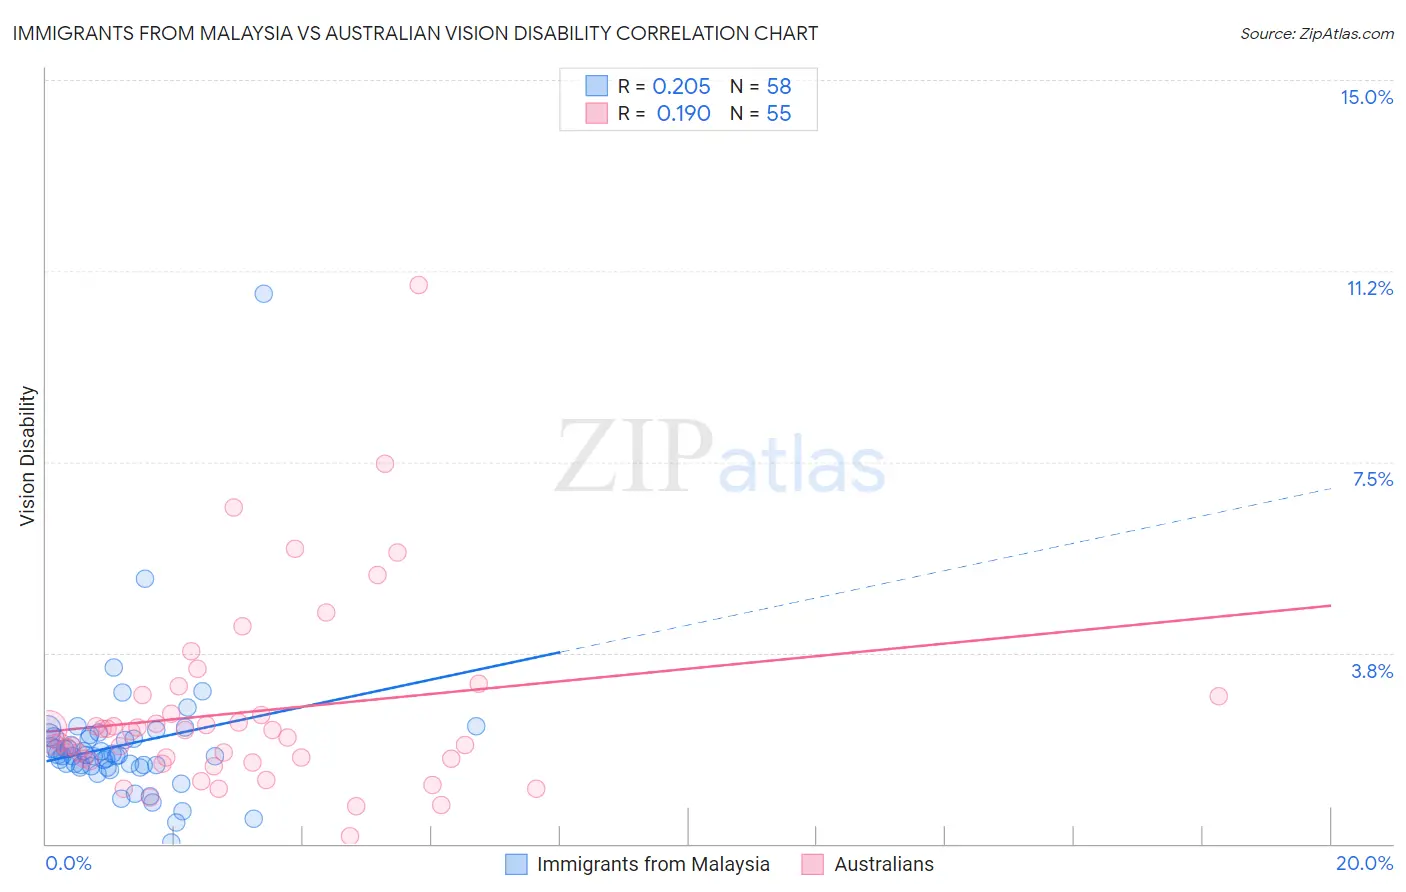
Immigrants from Malaysia vs Australian Vision Disability Correlation Chart
The statistical analysis conducted on geographies consisting of 197,931,356 people shows a weak positive correlation between the proportion of Immigrants from Malaysia and percentage of population with vision disability in the United States with a correlation coefficient (R) of 0.205 and weighted average of 1.9%. Similarly, the statistical analysis conducted on geographies consisting of 224,056,870 people shows a poor positive correlation between the proportion of Australians and percentage of population with vision disability in the United States with a correlation coefficient (R) of 0.190 and weighted average of 2.1%, a difference of 6.8%.
Vision Disability Correlation Summary
| Measurement | Immigrants from Malaysia | Australian |
| Minimum | 0.037% | 0.16% |
| Maximum | 10.8% | 11.0% |
| Range | 10.8% | 10.8% |
| Mean | 1.9% | 2.6% |
| Median | 1.7% | 2.2% |
| Interquartile 25% (IQ1) | 1.5% | 1.6% |
| Interquartile 75% (IQ3) | 2.1% | 2.9% |
| Interquartile Range (IQR) | 0.58% | 1.3% |
| Standard Deviation (Sample) | 1.4% | 1.9% |
| Standard Deviation (Population) | 1.4% | 1.8% |
Similar Demographics by Vision Disability
Demographics Similar to Immigrants from Malaysia by Vision Disability
In terms of vision disability, the demographic groups most similar to Immigrants from Malaysia are Taiwanese (1.9%, a difference of 0.020%), Egyptian (1.9%, a difference of 0.070%), Immigrants from Nepal (1.9%, a difference of 0.11%), Mongolian (1.9%, a difference of 0.27%), and Immigrants from Japan (1.9%, a difference of 0.36%).
| Demographics | Rating | Rank | Vision Disability |
| Turks | 100.0 /100 | #21 | Exceptional 1.9% |
| Immigrants | Pakistan | 100.0 /100 | #22 | Exceptional 1.9% |
| Immigrants | Asia | 99.9 /100 | #23 | Exceptional 1.9% |
| Immigrants | Lithuania | 99.9 /100 | #24 | Exceptional 1.9% |
| Bulgarians | 99.9 /100 | #25 | Exceptional 1.9% |
| Immigrants | Japan | 99.9 /100 | #26 | Exceptional 1.9% |
| Taiwanese | 99.9 /100 | #27 | Exceptional 1.9% |
| Immigrants | Malaysia | 99.9 /100 | #28 | Exceptional 1.9% |
| Egyptians | 99.9 /100 | #29 | Exceptional 1.9% |
| Immigrants | Nepal | 99.9 /100 | #30 | Exceptional 1.9% |
| Mongolians | 99.9 /100 | #31 | Exceptional 1.9% |
| Luxembourgers | 99.9 /100 | #32 | Exceptional 1.9% |
| Immigrants | Egypt | 99.9 /100 | #33 | Exceptional 1.9% |
| Immigrants | Turkey | 99.8 /100 | #34 | Exceptional 1.9% |
| Immigrants | Australia | 99.8 /100 | #35 | Exceptional 1.9% |
Demographics Similar to Australians by Vision Disability
In terms of vision disability, the demographic groups most similar to Australians are Romanian (2.1%, a difference of 0.060%), Immigrants from Croatia (2.1%, a difference of 0.070%), Immigrants from Europe (2.1%, a difference of 0.090%), Immigrants from Afghanistan (2.1%, a difference of 0.13%), and Immigrants from Syria (2.1%, a difference of 0.14%).
| Demographics | Rating | Rank | Vision Disability |
| Norwegians | 97.0 /100 | #88 | Exceptional 2.0% |
| Immigrants | Eastern Africa | 97.0 /100 | #89 | Exceptional 2.0% |
| Immigrants | Lebanon | 96.7 /100 | #90 | Exceptional 2.1% |
| Immigrants | Somalia | 96.2 /100 | #91 | Exceptional 2.1% |
| Immigrants | Syria | 96.2 /100 | #92 | Exceptional 2.1% |
| Immigrants | Europe | 96.1 /100 | #93 | Exceptional 2.1% |
| Immigrants | Croatia | 96.0 /100 | #94 | Exceptional 2.1% |
| Australians | 95.9 /100 | #95 | Exceptional 2.1% |
| Romanians | 95.7 /100 | #96 | Exceptional 2.1% |
| Immigrants | Afghanistan | 95.6 /100 | #97 | Exceptional 2.1% |
| Immigrants | South Africa | 95.4 /100 | #98 | Exceptional 2.1% |
| Estonians | 95.3 /100 | #99 | Exceptional 2.1% |
| Greeks | 95.1 /100 | #100 | Exceptional 2.1% |
| Albanians | 94.9 /100 | #101 | Exceptional 2.1% |
| Sri Lankans | 94.8 /100 | #102 | Exceptional 2.1% |