Romanian vs Russian Vision Disability
COMPARE
Romanian
Russian
Vision Disability
Vision Disability Comparison
Romanians
Russians
2.1%
VISION DISABILITY
95.7/ 100
METRIC RATING
96th/ 347
METRIC RANK
2.0%
VISION DISABILITY
98.6/ 100
METRIC RATING
69th/ 347
METRIC RANK
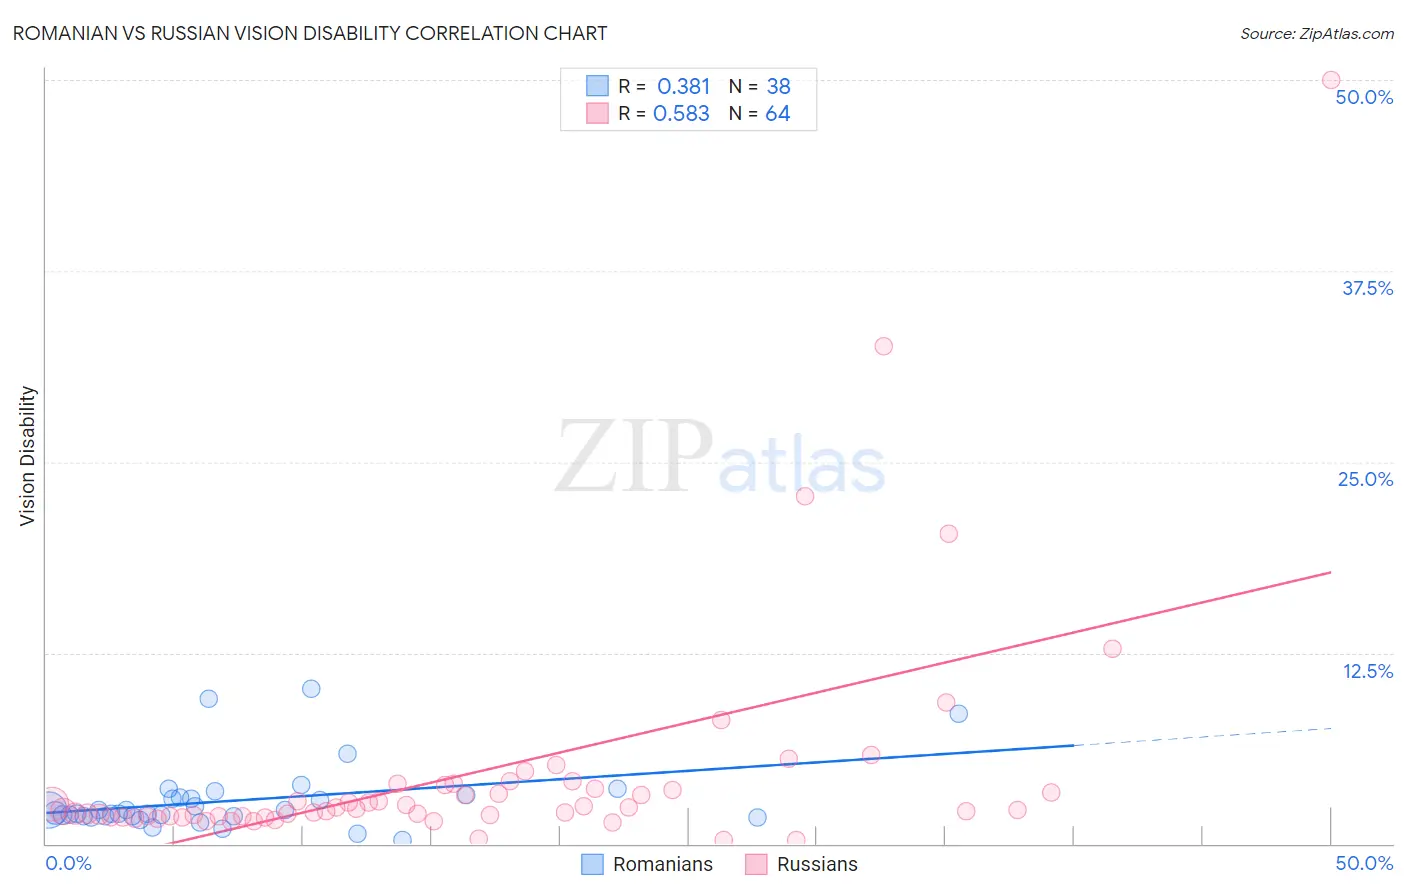
Romanian vs Russian Vision Disability Correlation Chart
The statistical analysis conducted on geographies consisting of 377,620,863 people shows a mild positive correlation between the proportion of Romanians and percentage of population with vision disability in the United States with a correlation coefficient (R) of 0.381 and weighted average of 2.1%. Similarly, the statistical analysis conducted on geographies consisting of 511,148,193 people shows a substantial positive correlation between the proportion of Russians and percentage of population with vision disability in the United States with a correlation coefficient (R) of 0.583 and weighted average of 2.0%, a difference of 1.9%.
Vision Disability Correlation Summary
| Measurement | Romanian | Russian |
| Minimum | 0.28% | 0.22% |
| Maximum | 10.2% | 50.0% |
| Range | 9.9% | 49.8% |
| Mean | 2.8% | 4.6% |
| Median | 2.0% | 2.2% |
| Interquartile 25% (IQ1) | 1.8% | 1.8% |
| Interquartile 75% (IQ3) | 3.0% | 3.7% |
| Interquartile Range (IQR) | 1.2% | 1.9% |
| Standard Deviation (Sample) | 2.2% | 7.8% |
| Standard Deviation (Population) | 2.2% | 7.8% |
Similar Demographics by Vision Disability
Demographics Similar to Romanians by Vision Disability
In terms of vision disability, the demographic groups most similar to Romanians are Australian (2.1%, a difference of 0.060%), Immigrants from Afghanistan (2.1%, a difference of 0.070%), Immigrants from South Africa (2.1%, a difference of 0.11%), Immigrants from Croatia (2.1%, a difference of 0.13%), and Immigrants from Europe (2.1%, a difference of 0.15%).
| Demographics | Rating | Rank | Vision Disability |
| Immigrants | Eastern Africa | 97.0 /100 | #89 | Exceptional 2.0% |
| Immigrants | Lebanon | 96.7 /100 | #90 | Exceptional 2.1% |
| Immigrants | Somalia | 96.2 /100 | #91 | Exceptional 2.1% |
| Immigrants | Syria | 96.2 /100 | #92 | Exceptional 2.1% |
| Immigrants | Europe | 96.1 /100 | #93 | Exceptional 2.1% |
| Immigrants | Croatia | 96.0 /100 | #94 | Exceptional 2.1% |
| Australians | 95.9 /100 | #95 | Exceptional 2.1% |
| Romanians | 95.7 /100 | #96 | Exceptional 2.1% |
| Immigrants | Afghanistan | 95.6 /100 | #97 | Exceptional 2.1% |
| Immigrants | South Africa | 95.4 /100 | #98 | Exceptional 2.1% |
| Estonians | 95.3 /100 | #99 | Exceptional 2.1% |
| Greeks | 95.1 /100 | #100 | Exceptional 2.1% |
| Albanians | 94.9 /100 | #101 | Exceptional 2.1% |
| Sri Lankans | 94.8 /100 | #102 | Exceptional 2.1% |
| Immigrants | Austria | 94.4 /100 | #103 | Exceptional 2.1% |
Demographics Similar to Russians by Vision Disability
In terms of vision disability, the demographic groups most similar to Russians are Immigrants from Kazakhstan (2.0%, a difference of 0.020%), Immigrants from Northern Europe (2.0%, a difference of 0.030%), Immigrants from France (2.0%, a difference of 0.080%), Immigrants from Czechoslovakia (2.0%, a difference of 0.17%), and Immigrants from Northern Africa (2.0%, a difference of 0.27%).
| Demographics | Rating | Rank | Vision Disability |
| Immigrants | Russia | 99.1 /100 | #62 | Exceptional 2.0% |
| Armenians | 99.0 /100 | #63 | Exceptional 2.0% |
| Immigrants | Greece | 99.0 /100 | #64 | Exceptional 2.0% |
| Maltese | 98.9 /100 | #65 | Exceptional 2.0% |
| Immigrants | Argentina | 98.9 /100 | #66 | Exceptional 2.0% |
| Immigrants | Northern Africa | 98.8 /100 | #67 | Exceptional 2.0% |
| Immigrants | Czechoslovakia | 98.7 /100 | #68 | Exceptional 2.0% |
| Russians | 98.6 /100 | #69 | Exceptional 2.0% |
| Immigrants | Kazakhstan | 98.6 /100 | #70 | Exceptional 2.0% |
| Immigrants | Northern Europe | 98.6 /100 | #71 | Exceptional 2.0% |
| Immigrants | France | 98.5 /100 | #72 | Exceptional 2.0% |
| Immigrants | Eritrea | 98.4 /100 | #73 | Exceptional 2.0% |
| Palestinians | 98.3 /100 | #74 | Exceptional 2.0% |
| Immigrants | North Macedonia | 98.3 /100 | #75 | Exceptional 2.0% |
| Paraguayans | 98.3 /100 | #76 | Exceptional 2.0% |