Bolivian vs Russian Vision Disability
COMPARE
Bolivian
Russian
Vision Disability
Vision Disability Comparison
Bolivians
Russians
1.9%
VISION DISABILITY
100.0/ 100
METRIC RATING
18th/ 347
METRIC RANK
2.0%
VISION DISABILITY
98.6/ 100
METRIC RATING
69th/ 347
METRIC RANK
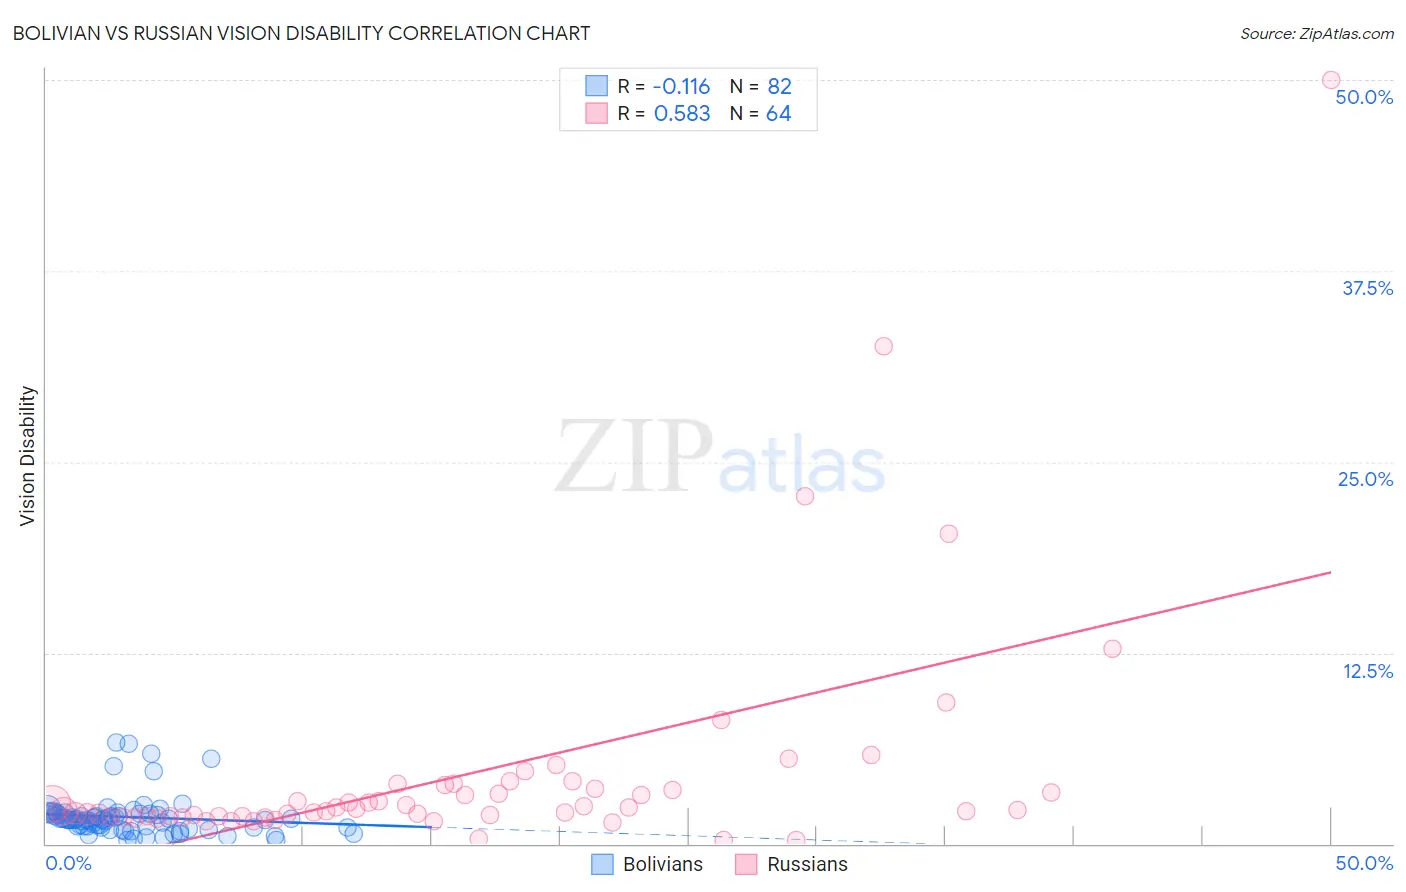
Bolivian vs Russian Vision Disability Correlation Chart
The statistical analysis conducted on geographies consisting of 184,625,860 people shows a poor negative correlation between the proportion of Bolivians and percentage of population with vision disability in the United States with a correlation coefficient (R) of -0.116 and weighted average of 1.9%. Similarly, the statistical analysis conducted on geographies consisting of 511,148,193 people shows a substantial positive correlation between the proportion of Russians and percentage of population with vision disability in the United States with a correlation coefficient (R) of 0.583 and weighted average of 2.0%, a difference of 8.8%.
Vision Disability Correlation Summary
| Measurement | Bolivian | Russian |
| Minimum | 0.21% | 0.22% |
| Maximum | 6.7% | 50.0% |
| Range | 6.4% | 49.8% |
| Mean | 1.8% | 4.6% |
| Median | 1.6% | 2.2% |
| Interquartile 25% (IQ1) | 1.1% | 1.8% |
| Interquartile 75% (IQ3) | 2.0% | 3.7% |
| Interquartile Range (IQR) | 0.85% | 1.9% |
| Standard Deviation (Sample) | 1.3% | 7.8% |
| Standard Deviation (Population) | 1.3% | 7.8% |
Similar Demographics by Vision Disability
Demographics Similar to Bolivians by Vision Disability
In terms of vision disability, the demographic groups most similar to Bolivians are Indian (Asian) (1.8%, a difference of 0.42%), Burmese (1.8%, a difference of 0.42%), Immigrants from Bolivia (1.8%, a difference of 0.87%), Immigrants from Sri Lanka (1.9%, a difference of 1.2%), and Immigrants from China (1.8%, a difference of 1.3%).
| Demographics | Rating | Rank | Vision Disability |
| Immigrants | Israel | 100.0 /100 | #11 | Exceptional 1.8% |
| Immigrants | Korea | 100.0 /100 | #12 | Exceptional 1.8% |
| Immigrants | Eastern Asia | 100.0 /100 | #13 | Exceptional 1.8% |
| Immigrants | China | 100.0 /100 | #14 | Exceptional 1.8% |
| Immigrants | Bolivia | 100.0 /100 | #15 | Exceptional 1.8% |
| Indians (Asian) | 100.0 /100 | #16 | Exceptional 1.8% |
| Burmese | 100.0 /100 | #17 | Exceptional 1.8% |
| Bolivians | 100.0 /100 | #18 | Exceptional 1.9% |
| Immigrants | Sri Lanka | 100.0 /100 | #19 | Exceptional 1.9% |
| Asians | 100.0 /100 | #20 | Exceptional 1.9% |
| Turks | 100.0 /100 | #21 | Exceptional 1.9% |
| Immigrants | Pakistan | 100.0 /100 | #22 | Exceptional 1.9% |
| Immigrants | Asia | 99.9 /100 | #23 | Exceptional 1.9% |
| Immigrants | Lithuania | 99.9 /100 | #24 | Exceptional 1.9% |
| Bulgarians | 99.9 /100 | #25 | Exceptional 1.9% |
Demographics Similar to Russians by Vision Disability
In terms of vision disability, the demographic groups most similar to Russians are Immigrants from Kazakhstan (2.0%, a difference of 0.020%), Immigrants from Northern Europe (2.0%, a difference of 0.030%), Immigrants from France (2.0%, a difference of 0.080%), Immigrants from Czechoslovakia (2.0%, a difference of 0.17%), and Immigrants from Northern Africa (2.0%, a difference of 0.27%).
| Demographics | Rating | Rank | Vision Disability |
| Immigrants | Russia | 99.1 /100 | #62 | Exceptional 2.0% |
| Armenians | 99.0 /100 | #63 | Exceptional 2.0% |
| Immigrants | Greece | 99.0 /100 | #64 | Exceptional 2.0% |
| Maltese | 98.9 /100 | #65 | Exceptional 2.0% |
| Immigrants | Argentina | 98.9 /100 | #66 | Exceptional 2.0% |
| Immigrants | Northern Africa | 98.8 /100 | #67 | Exceptional 2.0% |
| Immigrants | Czechoslovakia | 98.7 /100 | #68 | Exceptional 2.0% |
| Russians | 98.6 /100 | #69 | Exceptional 2.0% |
| Immigrants | Kazakhstan | 98.6 /100 | #70 | Exceptional 2.0% |
| Immigrants | Northern Europe | 98.6 /100 | #71 | Exceptional 2.0% |
| Immigrants | France | 98.5 /100 | #72 | Exceptional 2.0% |
| Immigrants | Eritrea | 98.4 /100 | #73 | Exceptional 2.0% |
| Palestinians | 98.3 /100 | #74 | Exceptional 2.0% |
| Immigrants | North Macedonia | 98.3 /100 | #75 | Exceptional 2.0% |
| Paraguayans | 98.3 /100 | #76 | Exceptional 2.0% |