Eastern European vs Sierra Leonean Disability
COMPARE
Eastern European
Sierra Leonean
Disability
Disability Comparison
Eastern Europeans
Sierra Leoneans
11.2%
DISABILITY
97.8/ 100
METRIC RATING
95th/ 347
METRIC RANK
11.0%
DISABILITY
99.3/ 100
METRIC RATING
76th/ 347
METRIC RANK
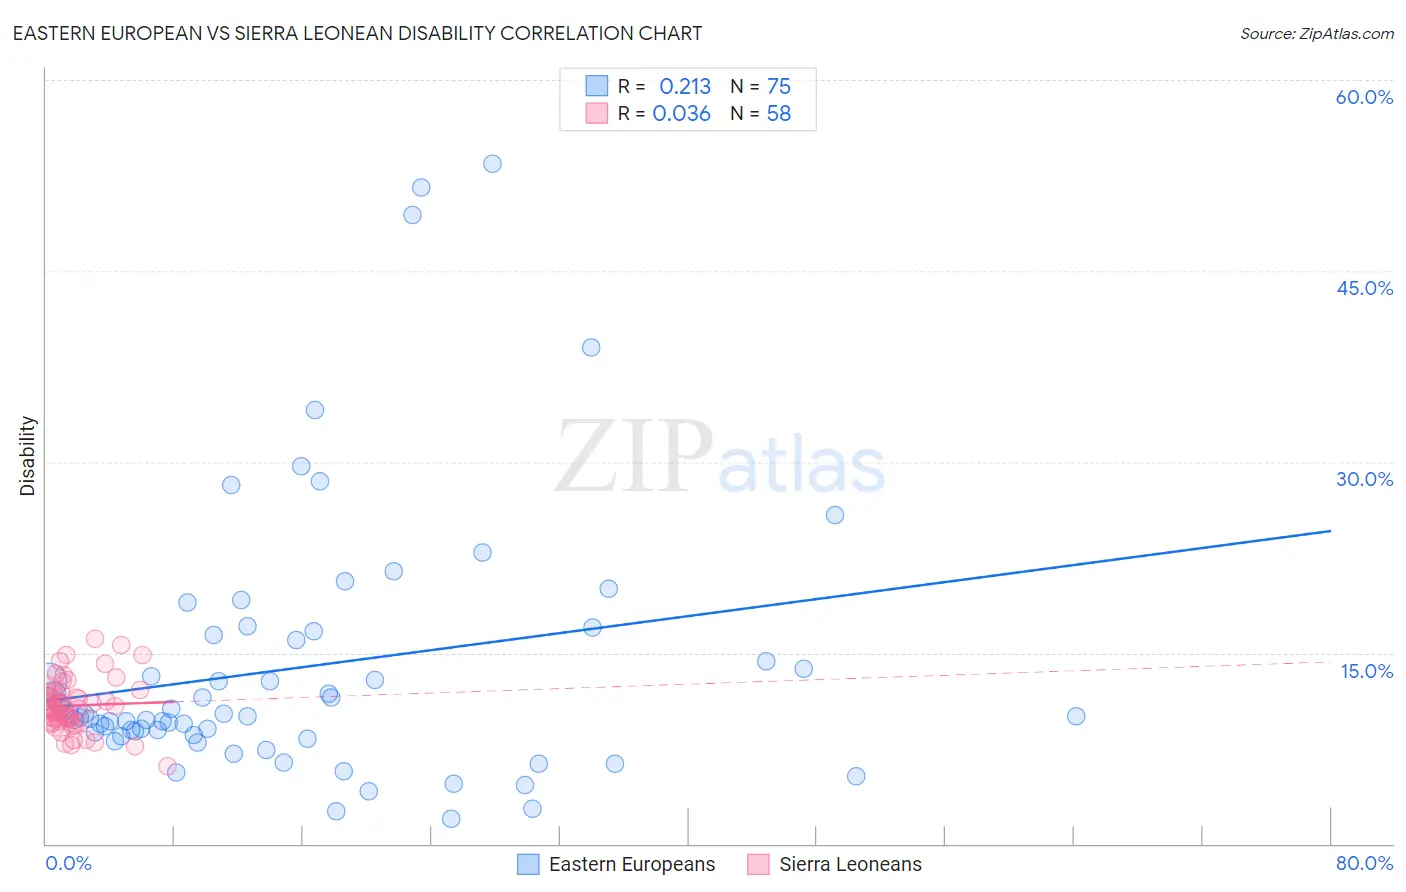
Eastern European vs Sierra Leonean Disability Correlation Chart
The statistical analysis conducted on geographies consisting of 461,211,417 people shows a weak positive correlation between the proportion of Eastern Europeans and percentage of population with a disability in the United States with a correlation coefficient (R) of 0.213 and weighted average of 11.2%. Similarly, the statistical analysis conducted on geographies consisting of 83,353,853 people shows no correlation between the proportion of Sierra Leoneans and percentage of population with a disability in the United States with a correlation coefficient (R) of 0.036 and weighted average of 11.0%, a difference of 1.4%.
Disability Correlation Summary
| Measurement | Eastern European | Sierra Leonean |
| Minimum | 2.0% | 6.1% |
| Maximum | 53.4% | 16.1% |
| Range | 51.5% | 10.0% |
| Mean | 13.9% | 10.9% |
| Median | 10.0% | 10.7% |
| Interquartile 25% (IQ1) | 8.6% | 9.5% |
| Interquartile 75% (IQ3) | 16.4% | 11.8% |
| Interquartile Range (IQR) | 7.9% | 2.3% |
| Standard Deviation (Sample) | 10.5% | 2.1% |
| Standard Deviation (Population) | 10.4% | 2.0% |
Demographics Similar to Eastern Europeans and Sierra Leoneans by Disability
In terms of disability, the demographic groups most similar to Eastern Europeans are Immigrants from Morocco (11.2%, a difference of 0.010%), Immigrants from Ecuador (11.2%, a difference of 0.12%), Ecuadorian (11.2%, a difference of 0.13%), Immigrants from Western Asia (11.2%, a difference of 0.16%), and Immigrants from Brazil (11.2%, a difference of 0.19%). Similarly, the demographic groups most similar to Sierra Leoneans are Immigrants from Belgium (11.0%, a difference of 0.0%), Immigrants from Vietnam (11.0%, a difference of 0.030%), Immigrants from Cameroon (11.1%, a difference of 0.040%), Immigrants from Jordan (11.1%, a difference of 0.080%), and Immigrants from Ireland (11.1%, a difference of 0.12%).
| Demographics | Rating | Rank | Disability |
| Immigrants | Vietnam | 99.4 /100 | #75 | Exceptional 11.0% |
| Sierra Leoneans | 99.3 /100 | #76 | Exceptional 11.0% |
| Immigrants | Belgium | 99.3 /100 | #77 | Exceptional 11.0% |
| Immigrants | Cameroon | 99.3 /100 | #78 | Exceptional 11.1% |
| Immigrants | Jordan | 99.3 /100 | #79 | Exceptional 11.1% |
| Immigrants | Ireland | 99.3 /100 | #80 | Exceptional 11.1% |
| Immigrants | Poland | 99.1 /100 | #81 | Exceptional 11.1% |
| Chileans | 99.1 /100 | #82 | Exceptional 11.1% |
| Immigrants | Switzerland | 99.0 /100 | #83 | Exceptional 11.1% |
| Immigrants | Sierra Leone | 99.0 /100 | #84 | Exceptional 11.1% |
| Immigrants | Belarus | 98.9 /100 | #85 | Exceptional 11.1% |
| Immigrants | Russia | 98.9 /100 | #86 | Exceptional 11.1% |
| Palestinians | 98.9 /100 | #87 | Exceptional 11.1% |
| Immigrants | Romania | 98.5 /100 | #88 | Exceptional 11.2% |
| Immigrants | South Africa | 98.2 /100 | #89 | Exceptional 11.2% |
| Immigrants | Brazil | 98.1 /100 | #90 | Exceptional 11.2% |
| Immigrants | Western Asia | 98.1 /100 | #91 | Exceptional 11.2% |
| Ecuadorians | 98.0 /100 | #92 | Exceptional 11.2% |
| Immigrants | Ecuador | 98.0 /100 | #93 | Exceptional 11.2% |
| Immigrants | Morocco | 97.8 /100 | #94 | Exceptional 11.2% |
| Eastern Europeans | 97.8 /100 | #95 | Exceptional 11.2% |