Immigrants from Liberia vs Japanese Cognitive Disability
COMPARE
Immigrants from Liberia
Japanese
Cognitive Disability
Cognitive Disability Comparison
Immigrants from Liberia
Japanese
18.7%
COGNITIVE DISABILITY
0.0/ 100
METRIC RATING
322nd/ 347
METRIC RANK
18.3%
COGNITIVE DISABILITY
0.0/ 100
METRIC RATING
298th/ 347
METRIC RANK
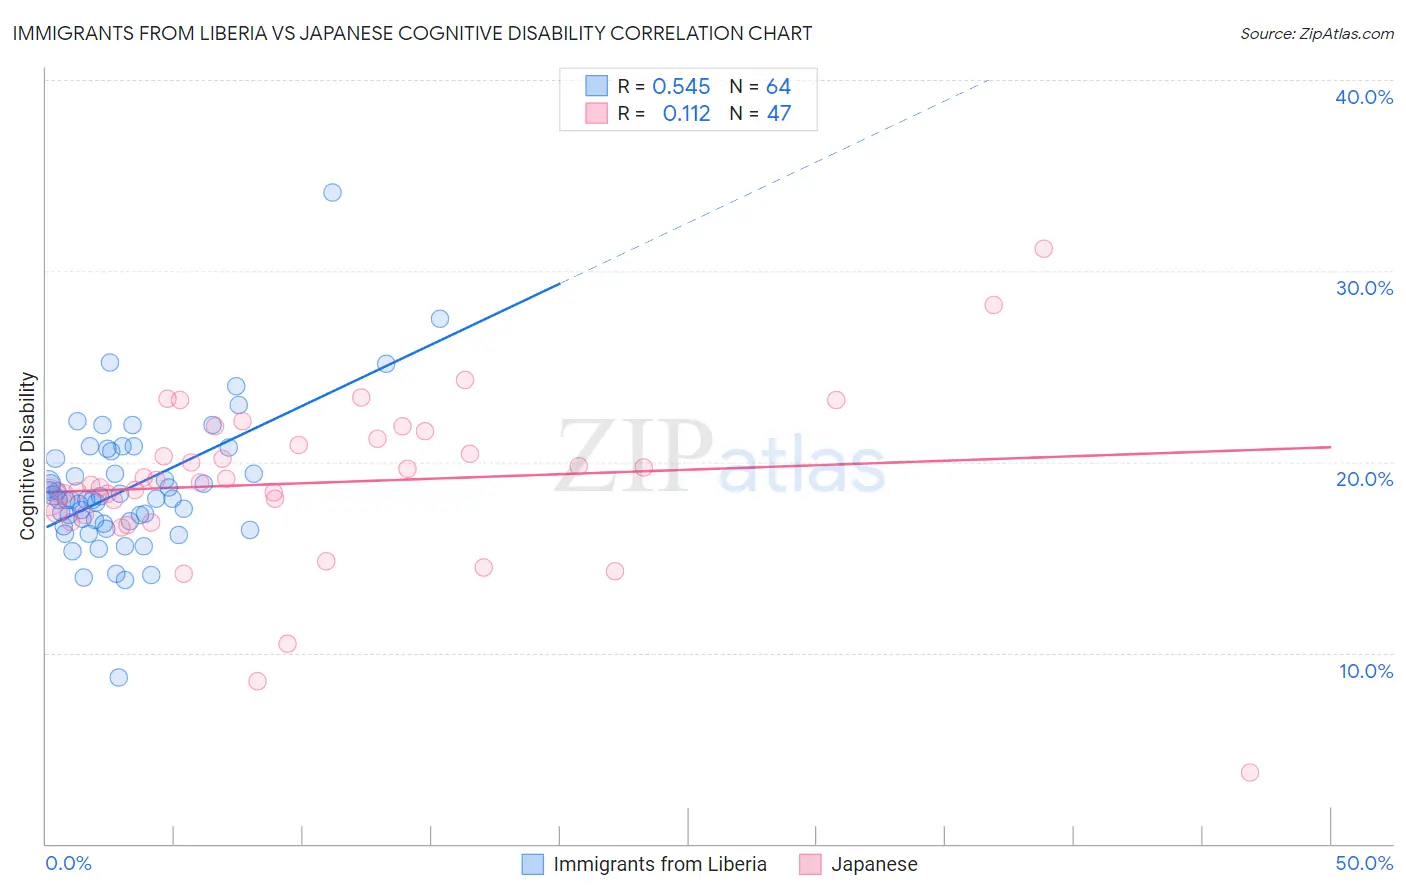
Immigrants from Liberia vs Japanese Cognitive Disability Correlation Chart
The statistical analysis conducted on geographies consisting of 135,261,320 people shows a substantial positive correlation between the proportion of Immigrants from Liberia and percentage of population with cognitive disability in the United States with a correlation coefficient (R) of 0.545 and weighted average of 18.7%. Similarly, the statistical analysis conducted on geographies consisting of 249,155,070 people shows a poor positive correlation between the proportion of Japanese and percentage of population with cognitive disability in the United States with a correlation coefficient (R) of 0.112 and weighted average of 18.3%, a difference of 2.2%.
Cognitive Disability Correlation Summary
| Measurement | Immigrants from Liberia | Japanese |
| Minimum | 8.7% | 3.7% |
| Maximum | 34.1% | 31.2% |
| Range | 25.4% | 27.4% |
| Mean | 18.7% | 18.9% |
| Median | 18.0% | 18.9% |
| Interquartile 25% (IQ1) | 16.8% | 17.2% |
| Interquartile 75% (IQ3) | 20.4% | 21.2% |
| Interquartile Range (IQR) | 3.6% | 4.0% |
| Standard Deviation (Sample) | 3.6% | 4.5% |
| Standard Deviation (Population) | 3.6% | 4.4% |
Similar Demographics by Cognitive Disability
Demographics Similar to Immigrants from Liberia by Cognitive Disability
In terms of cognitive disability, the demographic groups most similar to Immigrants from Liberia are Pueblo (18.7%, a difference of 0.020%), African (18.6%, a difference of 0.060%), Dominican (18.7%, a difference of 0.14%), Apache (18.6%, a difference of 0.16%), and Comanche (18.6%, a difference of 0.19%).
| Demographics | Rating | Rank | Cognitive Disability |
| Immigrants | Dominica | 0.0 /100 | #315 | Tragic 18.6% |
| Immigrants | Middle Africa | 0.0 /100 | #316 | Tragic 18.6% |
| Liberians | 0.0 /100 | #317 | Tragic 18.6% |
| Bangladeshis | 0.0 /100 | #318 | Tragic 18.6% |
| Comanche | 0.0 /100 | #319 | Tragic 18.6% |
| Apache | 0.0 /100 | #320 | Tragic 18.6% |
| Africans | 0.0 /100 | #321 | Tragic 18.6% |
| Immigrants | Liberia | 0.0 /100 | #322 | Tragic 18.7% |
| Pueblo | 0.0 /100 | #323 | Tragic 18.7% |
| Dominicans | 0.0 /100 | #324 | Tragic 18.7% |
| Indonesians | 0.0 /100 | #325 | Tragic 18.7% |
| Immigrants | Senegal | 0.0 /100 | #326 | Tragic 18.7% |
| U.S. Virgin Islanders | 0.0 /100 | #327 | Tragic 18.7% |
| Kiowa | 0.0 /100 | #328 | Tragic 18.7% |
| Navajo | 0.0 /100 | #329 | Tragic 18.8% |
Demographics Similar to Japanese by Cognitive Disability
In terms of cognitive disability, the demographic groups most similar to Japanese are Blackfeet (18.3%, a difference of 0.0%), Ghanaian (18.3%, a difference of 0.030%), Creek (18.3%, a difference of 0.060%), Immigrants from Burma/Myanmar (18.2%, a difference of 0.14%), and German Russian (18.2%, a difference of 0.17%).
| Demographics | Rating | Rank | Cognitive Disability |
| Ottawa | 0.1 /100 | #291 | Tragic 18.2% |
| Iroquois | 0.1 /100 | #292 | Tragic 18.2% |
| Central American Indians | 0.1 /100 | #293 | Tragic 18.2% |
| British West Indians | 0.1 /100 | #294 | Tragic 18.2% |
| German Russians | 0.0 /100 | #295 | Tragic 18.2% |
| Immigrants | Burma/Myanmar | 0.0 /100 | #296 | Tragic 18.2% |
| Blackfeet | 0.0 /100 | #297 | Tragic 18.3% |
| Japanese | 0.0 /100 | #298 | Tragic 18.3% |
| Ghanaians | 0.0 /100 | #299 | Tragic 18.3% |
| Creek | 0.0 /100 | #300 | Tragic 18.3% |
| Immigrants | Ghana | 0.0 /100 | #301 | Tragic 18.3% |
| Barbadians | 0.0 /100 | #302 | Tragic 18.3% |
| Immigrants | Kenya | 0.0 /100 | #303 | Tragic 18.3% |
| Immigrants | Eritrea | 0.0 /100 | #304 | Tragic 18.3% |
| Colville | 0.0 /100 | #305 | Tragic 18.3% |