Immigrants from Liberia vs Japanese Professional Degree
COMPARE
Immigrants from Liberia
Japanese
Professional Degree
Professional Degree Comparison
Immigrants from Liberia
Japanese
3.4%
PROFESSIONAL DEGREE
0.2/ 100
METRIC RATING
297th/ 347
METRIC RANK
3.5%
PROFESSIONAL DEGREE
0.5/ 100
METRIC RATING
278th/ 347
METRIC RANK
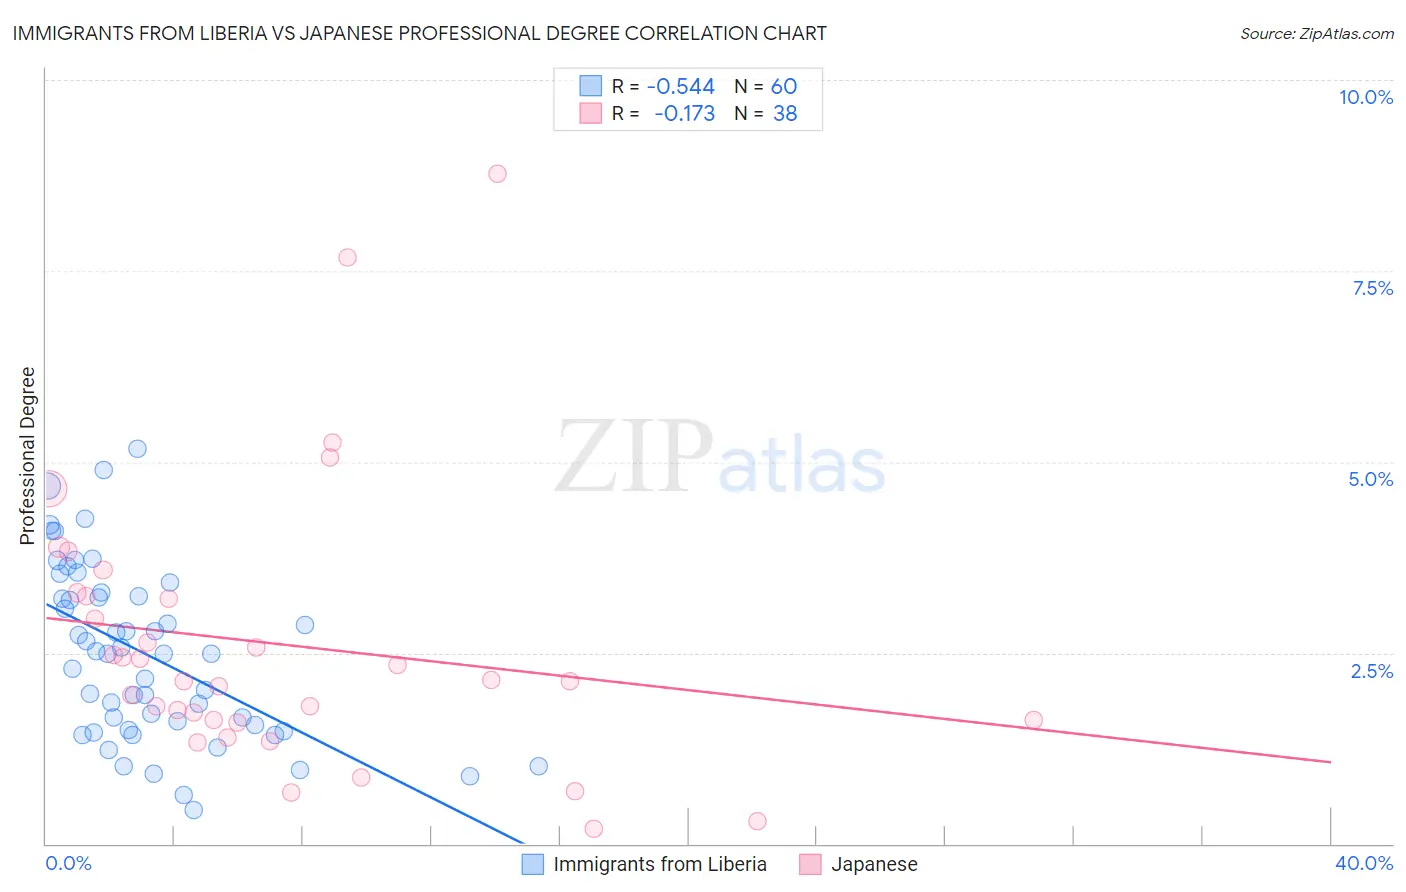
Immigrants from Liberia vs Japanese Professional Degree Correlation Chart
The statistical analysis conducted on geographies consisting of 135,135,221 people shows a substantial negative correlation between the proportion of Immigrants from Liberia and percentage of population with at least professional degree education in the United States with a correlation coefficient (R) of -0.544 and weighted average of 3.4%. Similarly, the statistical analysis conducted on geographies consisting of 248,858,798 people shows a poor negative correlation between the proportion of Japanese and percentage of population with at least professional degree education in the United States with a correlation coefficient (R) of -0.173 and weighted average of 3.5%, a difference of 3.4%.
Professional Degree Correlation Summary
| Measurement | Immigrants from Liberia | Japanese |
| Minimum | 0.44% | 0.20% |
| Maximum | 5.2% | 8.8% |
| Range | 4.7% | 8.6% |
| Mean | 2.5% | 2.6% |
| Median | 2.5% | 2.1% |
| Interquartile 25% (IQ1) | 1.5% | 1.6% |
| Interquartile 75% (IQ3) | 3.3% | 3.2% |
| Interquartile Range (IQR) | 1.7% | 1.6% |
| Standard Deviation (Sample) | 1.1% | 1.8% |
| Standard Deviation (Population) | 1.1% | 1.8% |
Demographics Similar to Immigrants from Liberia and Japanese by Professional Degree
In terms of professional degree, the demographic groups most similar to Immigrants from Liberia are Hawaiian (3.4%, a difference of 0.34%), Immigrants from Guatemala (3.4%, a difference of 0.35%), Paiute (3.4%, a difference of 0.50%), Immigrants from Honduras (3.5%, a difference of 0.59%), and Immigrants from Belize (3.5%, a difference of 0.82%). Similarly, the demographic groups most similar to Japanese are Immigrants from Portugal (3.5%, a difference of 0.040%), Cheyenne (3.6%, a difference of 0.060%), Dominican (3.5%, a difference of 0.080%), Apache (3.5%, a difference of 0.10%), and Immigrants from Caribbean (3.5%, a difference of 0.12%).
| Demographics | Rating | Rank | Professional Degree |
| Cheyenne | 0.5 /100 | #277 | Tragic 3.6% |
| Japanese | 0.5 /100 | #278 | Tragic 3.5% |
| Immigrants | Portugal | 0.5 /100 | #279 | Tragic 3.5% |
| Dominicans | 0.5 /100 | #280 | Tragic 3.5% |
| Apache | 0.5 /100 | #281 | Tragic 3.5% |
| Immigrants | Caribbean | 0.5 /100 | #282 | Tragic 3.5% |
| Comanche | 0.4 /100 | #283 | Tragic 3.5% |
| Salvadorans | 0.4 /100 | #284 | Tragic 3.5% |
| Hondurans | 0.3 /100 | #285 | Tragic 3.5% |
| Haitians | 0.3 /100 | #286 | Tragic 3.5% |
| Immigrants | El Salvador | 0.3 /100 | #287 | Tragic 3.5% |
| Blackfeet | 0.3 /100 | #288 | Tragic 3.5% |
| Guatemalans | 0.3 /100 | #289 | Tragic 3.5% |
| Chippewa | 0.3 /100 | #290 | Tragic 3.5% |
| Alaska Natives | 0.3 /100 | #291 | Tragic 3.5% |
| Immigrants | Belize | 0.3 /100 | #292 | Tragic 3.5% |
| Immigrants | Honduras | 0.3 /100 | #293 | Tragic 3.5% |
| Paiute | 0.3 /100 | #294 | Tragic 3.4% |
| Immigrants | Guatemala | 0.2 /100 | #295 | Tragic 3.4% |
| Hawaiians | 0.2 /100 | #296 | Tragic 3.4% |
| Immigrants | Liberia | 0.2 /100 | #297 | Tragic 3.4% |