Immigrants from Liberia vs Polish Cognitive Disability
COMPARE
Immigrants from Liberia
Polish
Cognitive Disability
Cognitive Disability Comparison
Immigrants from Liberia
Poles
18.7%
COGNITIVE DISABILITY
0.0/ 100
METRIC RATING
322nd/ 347
METRIC RANK
16.4%
COGNITIVE DISABILITY
99.9/ 100
METRIC RATING
28th/ 347
METRIC RANK
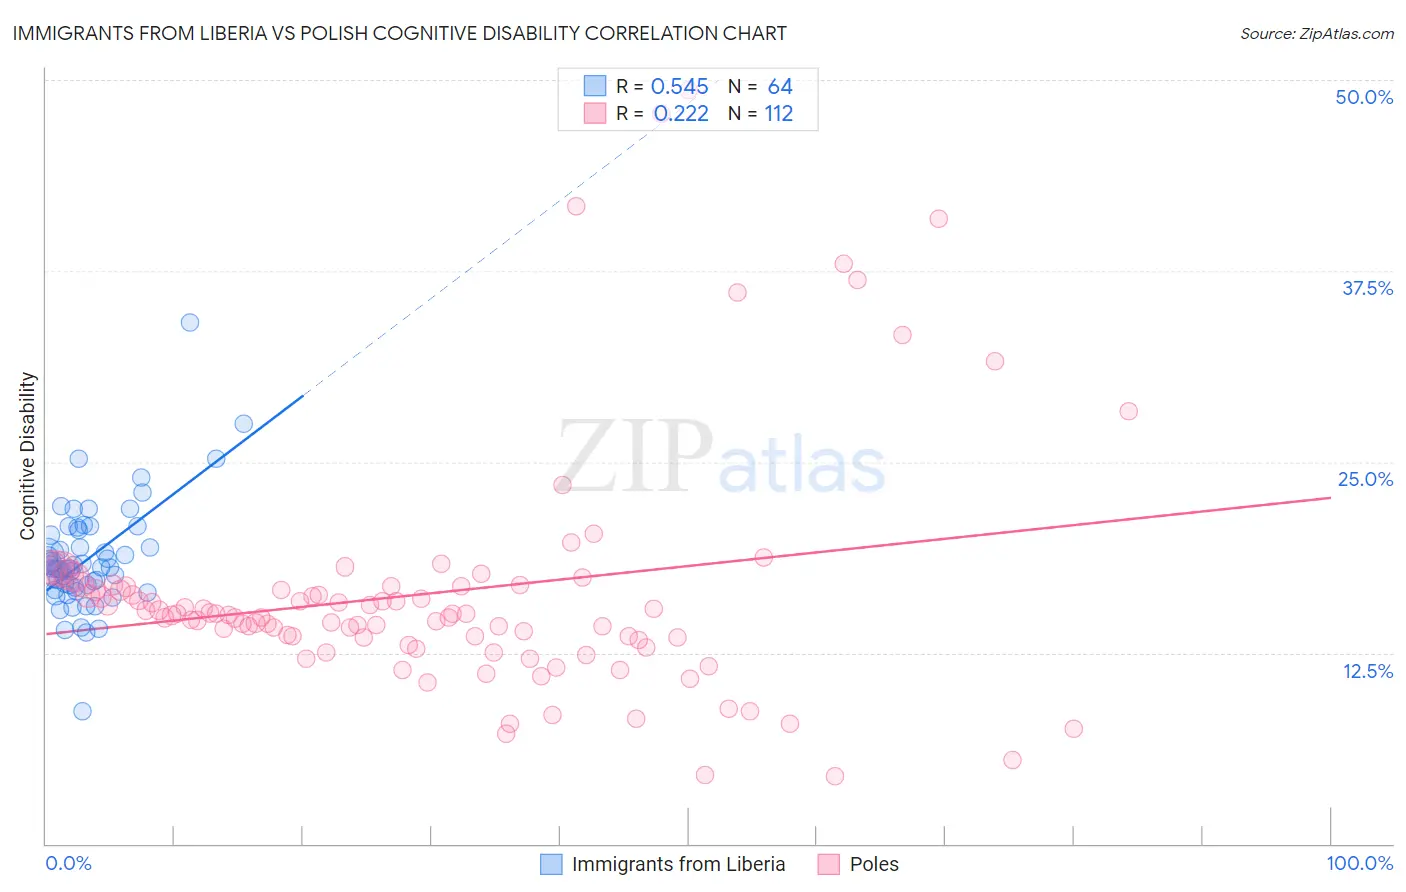
Immigrants from Liberia vs Polish Cognitive Disability Correlation Chart
The statistical analysis conducted on geographies consisting of 135,261,320 people shows a substantial positive correlation between the proportion of Immigrants from Liberia and percentage of population with cognitive disability in the United States with a correlation coefficient (R) of 0.545 and weighted average of 18.7%. Similarly, the statistical analysis conducted on geographies consisting of 560,438,383 people shows a weak positive correlation between the proportion of Poles and percentage of population with cognitive disability in the United States with a correlation coefficient (R) of 0.222 and weighted average of 16.4%, a difference of 13.9%.
Cognitive Disability Correlation Summary
| Measurement | Immigrants from Liberia | Polish |
| Minimum | 8.7% | 4.4% |
| Maximum | 34.1% | 49.3% |
| Range | 25.4% | 44.9% |
| Mean | 18.7% | 16.4% |
| Median | 18.0% | 15.0% |
| Interquartile 25% (IQ1) | 16.8% | 13.4% |
| Interquartile 75% (IQ3) | 20.4% | 16.8% |
| Interquartile Range (IQR) | 3.6% | 3.4% |
| Standard Deviation (Sample) | 3.6% | 7.8% |
| Standard Deviation (Population) | 3.6% | 7.8% |
Similar Demographics by Cognitive Disability
Demographics Similar to Immigrants from Liberia by Cognitive Disability
In terms of cognitive disability, the demographic groups most similar to Immigrants from Liberia are Pueblo (18.7%, a difference of 0.020%), African (18.6%, a difference of 0.060%), Dominican (18.7%, a difference of 0.14%), Apache (18.6%, a difference of 0.16%), and Comanche (18.6%, a difference of 0.19%).
| Demographics | Rating | Rank | Cognitive Disability |
| Immigrants | Dominica | 0.0 /100 | #315 | Tragic 18.6% |
| Immigrants | Middle Africa | 0.0 /100 | #316 | Tragic 18.6% |
| Liberians | 0.0 /100 | #317 | Tragic 18.6% |
| Bangladeshis | 0.0 /100 | #318 | Tragic 18.6% |
| Comanche | 0.0 /100 | #319 | Tragic 18.6% |
| Apache | 0.0 /100 | #320 | Tragic 18.6% |
| Africans | 0.0 /100 | #321 | Tragic 18.6% |
| Immigrants | Liberia | 0.0 /100 | #322 | Tragic 18.7% |
| Pueblo | 0.0 /100 | #323 | Tragic 18.7% |
| Dominicans | 0.0 /100 | #324 | Tragic 18.7% |
| Indonesians | 0.0 /100 | #325 | Tragic 18.7% |
| Immigrants | Senegal | 0.0 /100 | #326 | Tragic 18.7% |
| U.S. Virgin Islanders | 0.0 /100 | #327 | Tragic 18.7% |
| Kiowa | 0.0 /100 | #328 | Tragic 18.7% |
| Navajo | 0.0 /100 | #329 | Tragic 18.8% |
Demographics Similar to Poles by Cognitive Disability
In terms of cognitive disability, the demographic groups most similar to Poles are Immigrants from Pakistan (16.4%, a difference of 0.0%), Immigrants from Croatia (16.4%, a difference of 0.020%), Filipino (16.4%, a difference of 0.030%), Czech (16.4%, a difference of 0.030%), and Luxembourger (16.4%, a difference of 0.050%).
| Demographics | Rating | Rank | Cognitive Disability |
| Immigrants | Cuba | 100.0 /100 | #21 | Exceptional 16.3% |
| Immigrants | South Central Asia | 99.9 /100 | #22 | Exceptional 16.4% |
| Croatians | 99.9 /100 | #23 | Exceptional 16.4% |
| Immigrants | Argentina | 99.9 /100 | #24 | Exceptional 16.4% |
| Luxembourgers | 99.9 /100 | #25 | Exceptional 16.4% |
| Immigrants | Croatia | 99.9 /100 | #26 | Exceptional 16.4% |
| Immigrants | Pakistan | 99.9 /100 | #27 | Exceptional 16.4% |
| Poles | 99.9 /100 | #28 | Exceptional 16.4% |
| Filipinos | 99.9 /100 | #29 | Exceptional 16.4% |
| Czechs | 99.9 /100 | #30 | Exceptional 16.4% |
| Immigrants | Romania | 99.9 /100 | #31 | Exceptional 16.4% |
| Immigrants | Israel | 99.9 /100 | #32 | Exceptional 16.4% |
| Italians | 99.9 /100 | #33 | Exceptional 16.4% |
| Russians | 99.9 /100 | #34 | Exceptional 16.4% |
| Slovaks | 99.9 /100 | #35 | Exceptional 16.4% |