Immigrants from Liberia vs Japanese 9th Grade
COMPARE
Immigrants from Liberia
Japanese
9th Grade
9th Grade Comparison
Immigrants from Liberia
Japanese
94.5%
9TH GRADE
11.8/ 100
METRIC RATING
214th/ 347
METRIC RANK
92.6%
9TH GRADE
0.0/ 100
METRIC RATING
305th/ 347
METRIC RANK
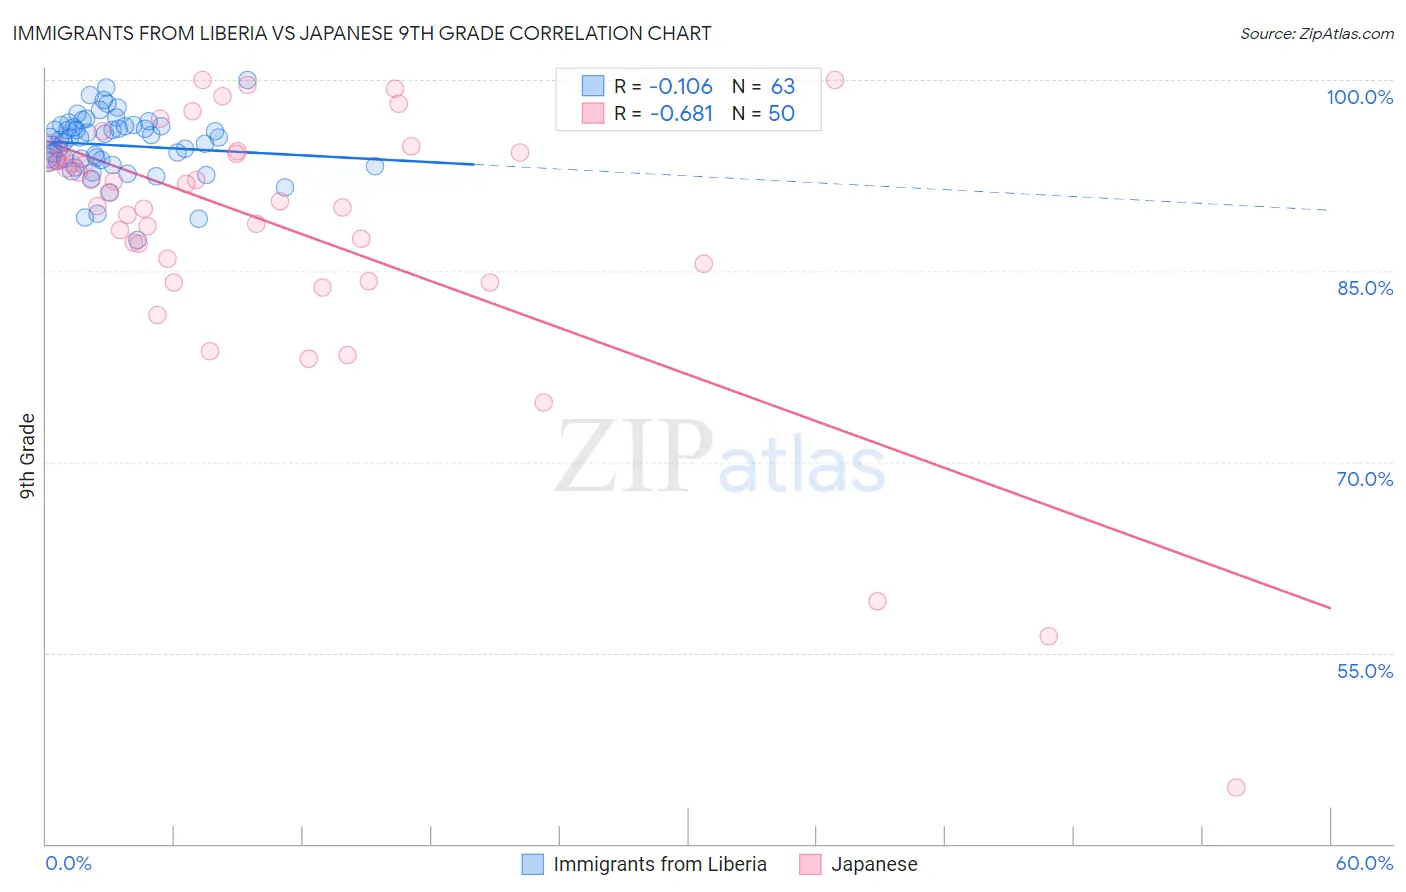
Immigrants from Liberia vs Japanese 9th Grade Correlation Chart
The statistical analysis conducted on geographies consisting of 135,292,614 people shows a poor negative correlation between the proportion of Immigrants from Liberia and percentage of population with at least 9th grade education in the United States with a correlation coefficient (R) of -0.106 and weighted average of 94.5%. Similarly, the statistical analysis conducted on geographies consisting of 249,183,224 people shows a significant negative correlation between the proportion of Japanese and percentage of population with at least 9th grade education in the United States with a correlation coefficient (R) of -0.681 and weighted average of 92.6%, a difference of 2.1%.
9th Grade Correlation Summary
| Measurement | Immigrants from Liberia | Japanese |
| Minimum | 87.4% | 44.4% |
| Maximum | 100.0% | 100.0% |
| Range | 12.6% | 55.6% |
| Mean | 94.9% | 88.3% |
| Median | 95.5% | 90.8% |
| Interquartile 25% (IQ1) | 93.6% | 85.6% |
| Interquartile 75% (IQ3) | 96.3% | 94.3% |
| Interquartile Range (IQR) | 2.7% | 8.7% |
| Standard Deviation (Sample) | 2.5% | 10.9% |
| Standard Deviation (Population) | 2.5% | 10.8% |
Similar Demographics by 9th Grade
Demographics Similar to Immigrants from Liberia by 9th Grade
In terms of 9th grade, the demographic groups most similar to Immigrants from Liberia are Immigrants from Oceania (94.5%, a difference of 0.0%), Immigrants from Indonesia (94.5%, a difference of 0.010%), Immigrants from Malaysia (94.5%, a difference of 0.010%), Immigrants from Syria (94.5%, a difference of 0.010%), and Immigrants from Western Asia (94.5%, a difference of 0.020%).
| Demographics | Rating | Rank | 9th Grade |
| Immigrants | Morocco | 16.3 /100 | #207 | Poor 94.6% |
| Immigrants | Pakistan | 15.5 /100 | #208 | Poor 94.6% |
| Comanche | 14.9 /100 | #209 | Poor 94.6% |
| Immigrants | Chile | 13.4 /100 | #210 | Poor 94.5% |
| Immigrants | Indonesia | 12.3 /100 | #211 | Poor 94.5% |
| Immigrants | Malaysia | 12.2 /100 | #212 | Poor 94.5% |
| Immigrants | Oceania | 12.1 /100 | #213 | Poor 94.5% |
| Immigrants | Liberia | 11.8 /100 | #214 | Poor 94.5% |
| Immigrants | Syria | 11.0 /100 | #215 | Poor 94.5% |
| Immigrants | Western Asia | 10.7 /100 | #216 | Poor 94.5% |
| Asians | 9.9 /100 | #217 | Tragic 94.5% |
| Portuguese | 9.2 /100 | #218 | Tragic 94.5% |
| Africans | 9.0 /100 | #219 | Tragic 94.5% |
| Indians (Asian) | 8.6 /100 | #220 | Tragic 94.5% |
| Immigrants | Eastern Africa | 8.2 /100 | #221 | Tragic 94.5% |
Demographics Similar to Japanese by 9th Grade
In terms of 9th grade, the demographic groups most similar to Japanese are Immigrants from Vietnam (92.6%, a difference of 0.0%), Tohono O'odham (92.6%, a difference of 0.020%), Guyanese (92.7%, a difference of 0.040%), Immigrants from Dominica (92.7%, a difference of 0.060%), and Immigrants (92.5%, a difference of 0.10%).
| Demographics | Rating | Rank | 9th Grade |
| Haitians | 0.0 /100 | #298 | Tragic 93.1% |
| Immigrants | Grenada | 0.0 /100 | #299 | Tragic 93.0% |
| Yaqui | 0.0 /100 | #300 | Tragic 92.9% |
| Immigrants | Haiti | 0.0 /100 | #301 | Tragic 92.7% |
| Immigrants | Dominica | 0.0 /100 | #302 | Tragic 92.7% |
| Guyanese | 0.0 /100 | #303 | Tragic 92.7% |
| Tohono O'odham | 0.0 /100 | #304 | Tragic 92.6% |
| Japanese | 0.0 /100 | #305 | Tragic 92.6% |
| Immigrants | Vietnam | 0.0 /100 | #306 | Tragic 92.6% |
| Immigrants | Immigrants | 0.0 /100 | #307 | Tragic 92.5% |
| Immigrants | Guyana | 0.0 /100 | #308 | Tragic 92.5% |
| Immigrants | Bangladesh | 0.0 /100 | #309 | Tragic 92.4% |
| Immigrants | Cambodia | 0.0 /100 | #310 | Tragic 92.4% |
| Immigrants | Fiji | 0.0 /100 | #311 | Tragic 92.3% |
| Houma | 0.0 /100 | #312 | Tragic 92.3% |