Immigrants from Argentina vs Japanese Cognitive Disability
COMPARE
Immigrants from Argentina
Japanese
Cognitive Disability
Cognitive Disability Comparison
Immigrants from Argentina
Japanese
16.4%
COGNITIVE DISABILITY
99.9/ 100
METRIC RATING
24th/ 347
METRIC RANK
18.3%
COGNITIVE DISABILITY
0.0/ 100
METRIC RATING
298th/ 347
METRIC RANK
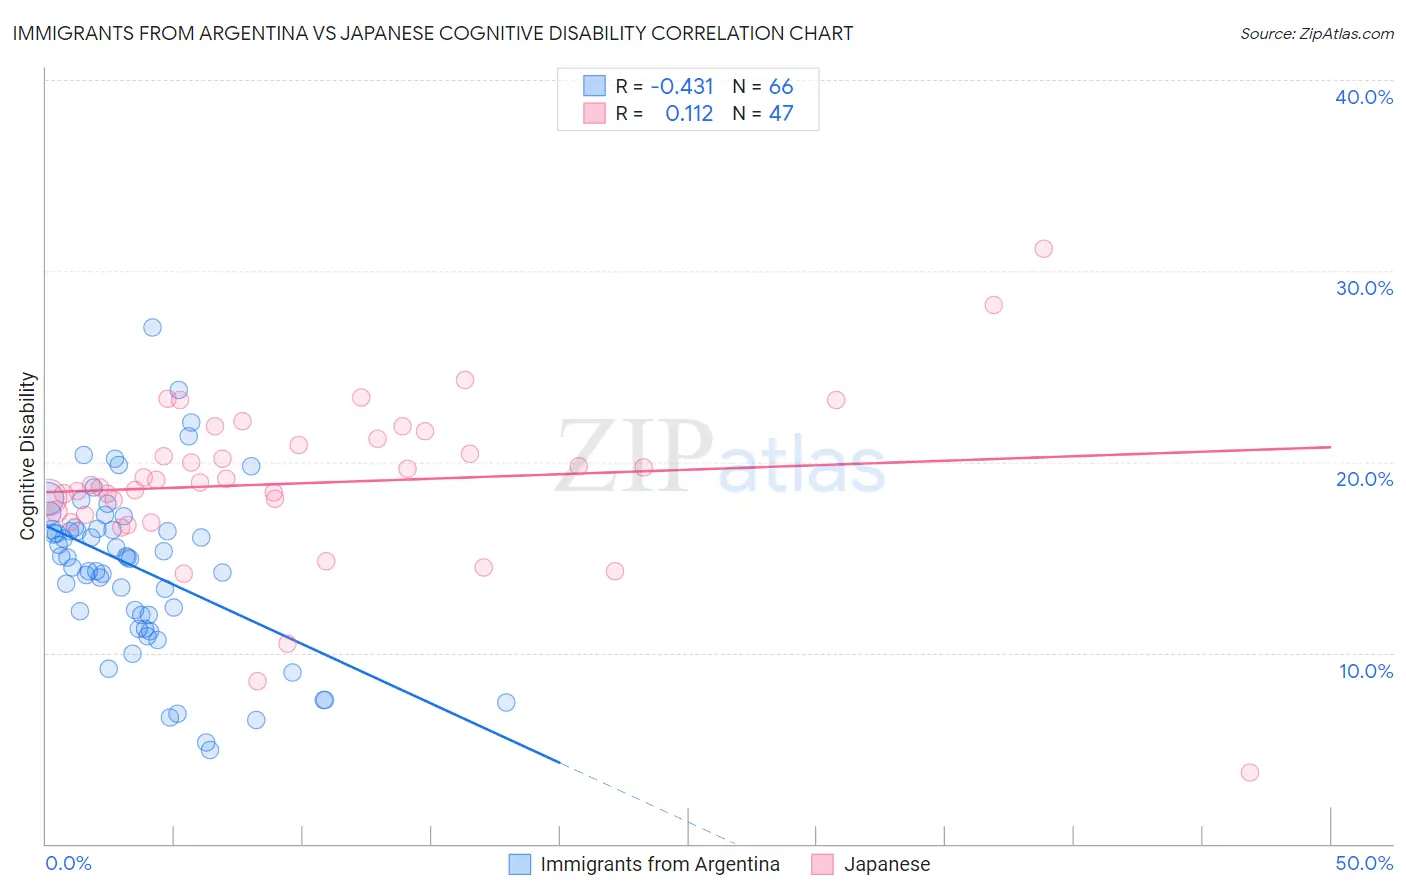
Immigrants from Argentina vs Japanese Cognitive Disability Correlation Chart
The statistical analysis conducted on geographies consisting of 264,433,945 people shows a moderate negative correlation between the proportion of Immigrants from Argentina and percentage of population with cognitive disability in the United States with a correlation coefficient (R) of -0.431 and weighted average of 16.4%. Similarly, the statistical analysis conducted on geographies consisting of 249,155,070 people shows a poor positive correlation between the proportion of Japanese and percentage of population with cognitive disability in the United States with a correlation coefficient (R) of 0.112 and weighted average of 18.3%, a difference of 11.6%.
Cognitive Disability Correlation Summary
| Measurement | Immigrants from Argentina | Japanese |
| Minimum | 4.9% | 3.7% |
| Maximum | 27.0% | 31.2% |
| Range | 22.1% | 27.4% |
| Mean | 14.4% | 18.9% |
| Median | 15.0% | 18.9% |
| Interquartile 25% (IQ1) | 11.9% | 17.2% |
| Interquartile 75% (IQ3) | 16.5% | 21.2% |
| Interquartile Range (IQR) | 4.6% | 4.0% |
| Standard Deviation (Sample) | 4.4% | 4.5% |
| Standard Deviation (Population) | 4.4% | 4.4% |
Similar Demographics by Cognitive Disability
Demographics Similar to Immigrants from Argentina by Cognitive Disability
In terms of cognitive disability, the demographic groups most similar to Immigrants from Argentina are Croatian (16.4%, a difference of 0.030%), Luxembourger (16.4%, a difference of 0.040%), Immigrants from South Central Asia (16.4%, a difference of 0.060%), Immigrants from Croatia (16.4%, a difference of 0.070%), and Immigrants from Pakistan (16.4%, a difference of 0.090%).
| Demographics | Rating | Rank | Cognitive Disability |
| Immigrants | North Macedonia | 100.0 /100 | #17 | Exceptional 16.3% |
| Immigrants | Northern Europe | 100.0 /100 | #18 | Exceptional 16.3% |
| Immigrants | Bolivia | 100.0 /100 | #19 | Exceptional 16.3% |
| Bulgarians | 100.0 /100 | #20 | Exceptional 16.3% |
| Immigrants | Cuba | 100.0 /100 | #21 | Exceptional 16.3% |
| Immigrants | South Central Asia | 99.9 /100 | #22 | Exceptional 16.4% |
| Croatians | 99.9 /100 | #23 | Exceptional 16.4% |
| Immigrants | Argentina | 99.9 /100 | #24 | Exceptional 16.4% |
| Luxembourgers | 99.9 /100 | #25 | Exceptional 16.4% |
| Immigrants | Croatia | 99.9 /100 | #26 | Exceptional 16.4% |
| Immigrants | Pakistan | 99.9 /100 | #27 | Exceptional 16.4% |
| Poles | 99.9 /100 | #28 | Exceptional 16.4% |
| Filipinos | 99.9 /100 | #29 | Exceptional 16.4% |
| Czechs | 99.9 /100 | #30 | Exceptional 16.4% |
| Immigrants | Romania | 99.9 /100 | #31 | Exceptional 16.4% |
Demographics Similar to Japanese by Cognitive Disability
In terms of cognitive disability, the demographic groups most similar to Japanese are Blackfeet (18.3%, a difference of 0.0%), Ghanaian (18.3%, a difference of 0.030%), Creek (18.3%, a difference of 0.060%), Immigrants from Burma/Myanmar (18.2%, a difference of 0.14%), and German Russian (18.2%, a difference of 0.17%).
| Demographics | Rating | Rank | Cognitive Disability |
| Ottawa | 0.1 /100 | #291 | Tragic 18.2% |
| Iroquois | 0.1 /100 | #292 | Tragic 18.2% |
| Central American Indians | 0.1 /100 | #293 | Tragic 18.2% |
| British West Indians | 0.1 /100 | #294 | Tragic 18.2% |
| German Russians | 0.0 /100 | #295 | Tragic 18.2% |
| Immigrants | Burma/Myanmar | 0.0 /100 | #296 | Tragic 18.2% |
| Blackfeet | 0.0 /100 | #297 | Tragic 18.3% |
| Japanese | 0.0 /100 | #298 | Tragic 18.3% |
| Ghanaians | 0.0 /100 | #299 | Tragic 18.3% |
| Creek | 0.0 /100 | #300 | Tragic 18.3% |
| Immigrants | Ghana | 0.0 /100 | #301 | Tragic 18.3% |
| Barbadians | 0.0 /100 | #302 | Tragic 18.3% |
| Immigrants | Kenya | 0.0 /100 | #303 | Tragic 18.3% |
| Immigrants | Eritrea | 0.0 /100 | #304 | Tragic 18.3% |
| Colville | 0.0 /100 | #305 | Tragic 18.3% |