Immigrants from Liberia vs Spanish American Disability
COMPARE
Immigrants from Liberia
Spanish American
Disability
Disability Comparison
Immigrants from Liberia
Spanish Americans
12.4%
DISABILITY
0.4/ 100
METRIC RATING
260th/ 347
METRIC RANK
13.6%
DISABILITY
0.0/ 100
METRIC RATING
312th/ 347
METRIC RANK
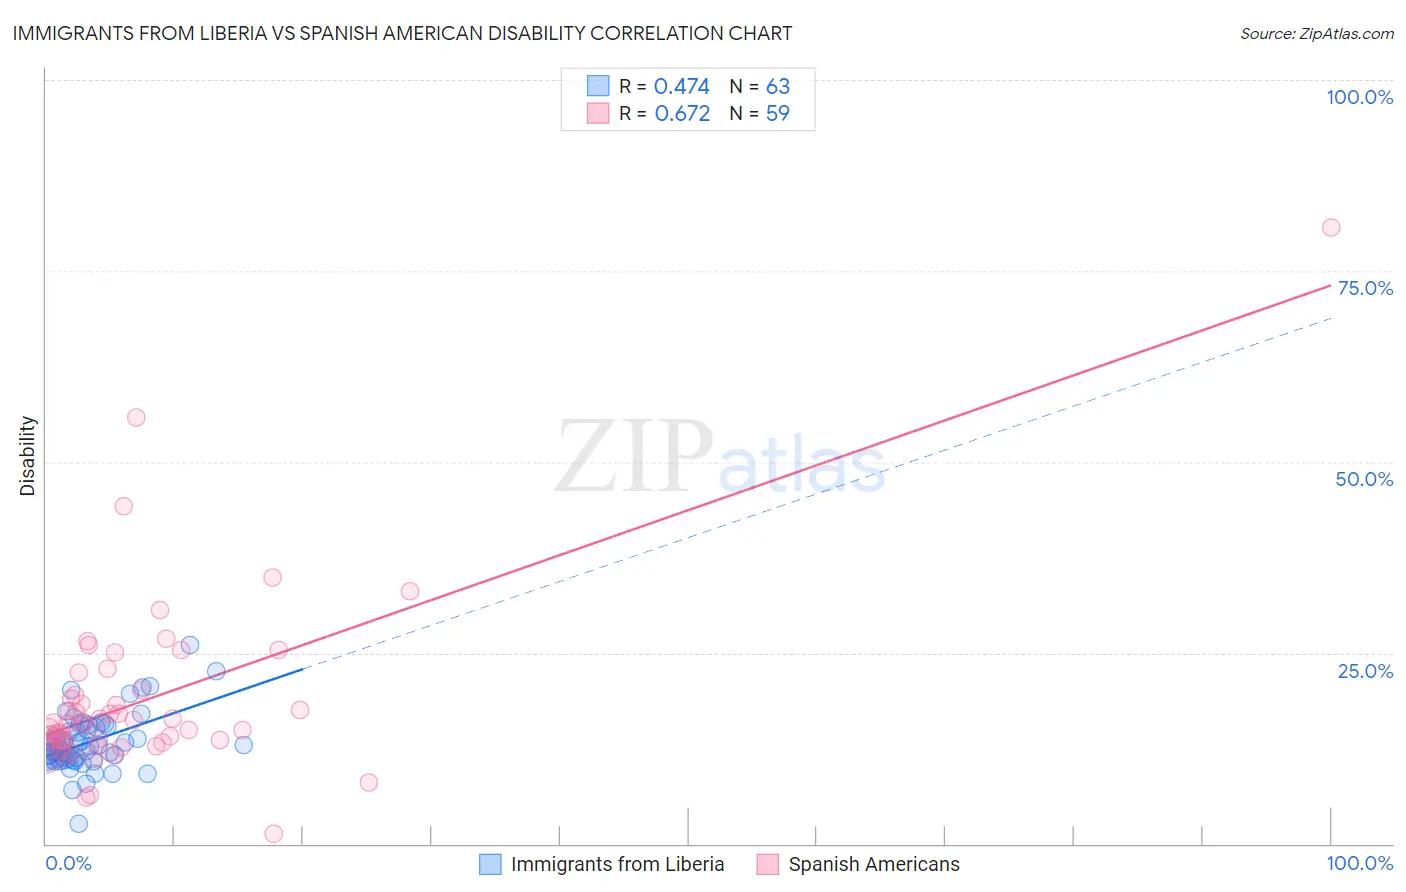
Immigrants from Liberia vs Spanish American Disability Correlation Chart
The statistical analysis conducted on geographies consisting of 135,259,590 people shows a moderate positive correlation between the proportion of Immigrants from Liberia and percentage of population with a disability in the United States with a correlation coefficient (R) of 0.474 and weighted average of 12.4%. Similarly, the statistical analysis conducted on geographies consisting of 103,168,597 people shows a significant positive correlation between the proportion of Spanish Americans and percentage of population with a disability in the United States with a correlation coefficient (R) of 0.672 and weighted average of 13.6%, a difference of 10.0%.
Disability Correlation Summary
| Measurement | Immigrants from Liberia | Spanish American |
| Minimum | 2.6% | 1.3% |
| Maximum | 26.0% | 80.7% |
| Range | 23.4% | 79.5% |
| Mean | 13.3% | 18.8% |
| Median | 12.5% | 15.7% |
| Interquartile 25% (IQ1) | 11.2% | 13.3% |
| Interquartile 75% (IQ3) | 15.2% | 20.1% |
| Interquartile Range (IQR) | 4.1% | 6.8% |
| Standard Deviation (Sample) | 3.7% | 12.0% |
| Standard Deviation (Population) | 3.7% | 11.9% |
Similar Demographics by Disability
Demographics Similar to Immigrants from Liberia by Disability
In terms of disability, the demographic groups most similar to Immigrants from Liberia are Canadian (12.4%, a difference of 0.030%), Scandinavian (12.4%, a difference of 0.070%), Slavic (12.4%, a difference of 0.090%), Immigrants from Laos (12.4%, a difference of 0.23%), and Immigrants from Dominica (12.4%, a difference of 0.32%).
| Demographics | Rating | Rank | Disability |
| Belgians | 0.8 /100 | #253 | Tragic 12.3% |
| German Russians | 0.8 /100 | #254 | Tragic 12.3% |
| Slovenes | 0.6 /100 | #255 | Tragic 12.4% |
| Immigrants | Dominica | 0.6 /100 | #256 | Tragic 12.4% |
| Immigrants | Laos | 0.5 /100 | #257 | Tragic 12.4% |
| Slavs | 0.5 /100 | #258 | Tragic 12.4% |
| Canadians | 0.4 /100 | #259 | Tragic 12.4% |
| Immigrants | Liberia | 0.4 /100 | #260 | Tragic 12.4% |
| Scandinavians | 0.4 /100 | #261 | Tragic 12.4% |
| Native Hawaiians | 0.3 /100 | #262 | Tragic 12.5% |
| Hawaiians | 0.2 /100 | #263 | Tragic 12.5% |
| Immigrants | Germany | 0.2 /100 | #264 | Tragic 12.5% |
| U.S. Virgin Islanders | 0.2 /100 | #265 | Tragic 12.5% |
| Czechoslovakians | 0.2 /100 | #266 | Tragic 12.5% |
| Spaniards | 0.2 /100 | #267 | Tragic 12.5% |
Demographics Similar to Spanish Americans by Disability
In terms of disability, the demographic groups most similar to Spanish Americans are Delaware (13.6%, a difference of 0.24%), Blackfeet (13.6%, a difference of 0.28%), Cree (13.7%, a difference of 0.35%), Black/African American (13.7%, a difference of 0.39%), and Puget Sound Salish (13.7%, a difference of 0.39%).
| Demographics | Rating | Rank | Disability |
| French Canadians | 0.0 /100 | #305 | Tragic 13.4% |
| Cape Verdeans | 0.0 /100 | #306 | Tragic 13.5% |
| Shoshone | 0.0 /100 | #307 | Tragic 13.5% |
| French American Indians | 0.0 /100 | #308 | Tragic 13.5% |
| Tlingit-Haida | 0.0 /100 | #309 | Tragic 13.5% |
| Blackfeet | 0.0 /100 | #310 | Tragic 13.6% |
| Delaware | 0.0 /100 | #311 | Tragic 13.6% |
| Spanish Americans | 0.0 /100 | #312 | Tragic 13.6% |
| Cree | 0.0 /100 | #313 | Tragic 13.7% |
| Blacks/African Americans | 0.0 /100 | #314 | Tragic 13.7% |
| Puget Sound Salish | 0.0 /100 | #315 | Tragic 13.7% |
| Pima | 0.0 /100 | #316 | Tragic 13.7% |
| Immigrants | Cabo Verde | 0.0 /100 | #317 | Tragic 13.7% |
| Menominee | 0.0 /100 | #318 | Tragic 13.8% |
| Iroquois | 0.0 /100 | #319 | Tragic 13.8% |