Immigrants from Lebanon vs Choctaw Cognitive Disability
COMPARE
Immigrants from Lebanon
Choctaw
Cognitive Disability
Cognitive Disability Comparison
Immigrants from Lebanon
Choctaw
16.8%
COGNITIVE DISABILITY
98.4/ 100
METRIC RATING
98th/ 347
METRIC RANK
18.4%
COGNITIVE DISABILITY
0.0/ 100
METRIC RATING
310th/ 347
METRIC RANK
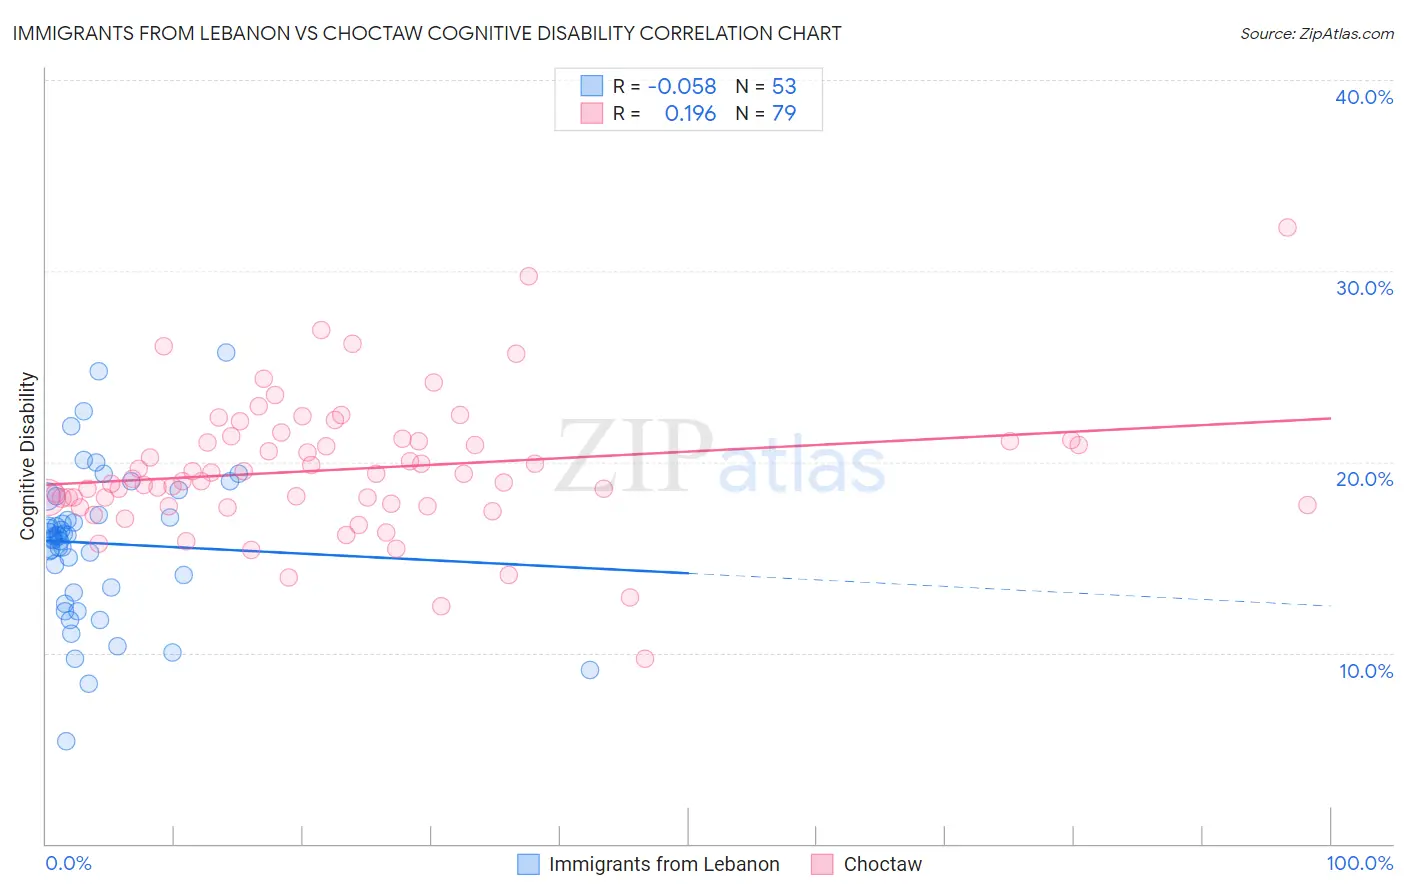
Immigrants from Lebanon vs Choctaw Cognitive Disability Correlation Chart
The statistical analysis conducted on geographies consisting of 217,153,550 people shows a slight negative correlation between the proportion of Immigrants from Lebanon and percentage of population with cognitive disability in the United States with a correlation coefficient (R) of -0.058 and weighted average of 16.8%. Similarly, the statistical analysis conducted on geographies consisting of 269,665,834 people shows a poor positive correlation between the proportion of Choctaw and percentage of population with cognitive disability in the United States with a correlation coefficient (R) of 0.196 and weighted average of 18.4%, a difference of 10.0%.
Cognitive Disability Correlation Summary
| Measurement | Immigrants from Lebanon | Choctaw |
| Minimum | 5.4% | 9.7% |
| Maximum | 25.7% | 32.3% |
| Range | 20.3% | 22.6% |
| Mean | 15.7% | 19.6% |
| Median | 16.1% | 19.1% |
| Interquartile 25% (IQ1) | 13.3% | 17.8% |
| Interquartile 75% (IQ3) | 17.7% | 21.1% |
| Interquartile Range (IQR) | 4.4% | 3.4% |
| Standard Deviation (Sample) | 3.9% | 3.6% |
| Standard Deviation (Population) | 3.9% | 3.5% |
Similar Demographics by Cognitive Disability
Demographics Similar to Immigrants from Lebanon by Cognitive Disability
In terms of cognitive disability, the demographic groups most similar to Immigrants from Lebanon are Dutch (16.8%, a difference of 0.020%), Finnish (16.8%, a difference of 0.040%), English (16.8%, a difference of 0.060%), Jordanian (16.8%, a difference of 0.090%), and Asian (16.7%, a difference of 0.12%).
| Demographics | Rating | Rank | Cognitive Disability |
| Danes | 98.8 /100 | #91 | Exceptional 16.7% |
| Immigrants | South America | 98.8 /100 | #92 | Exceptional 16.7% |
| Immigrants | Southern Europe | 98.7 /100 | #93 | Exceptional 16.7% |
| Asians | 98.7 /100 | #94 | Exceptional 16.7% |
| English | 98.6 /100 | #95 | Exceptional 16.8% |
| Finns | 98.5 /100 | #96 | Exceptional 16.8% |
| Dutch | 98.5 /100 | #97 | Exceptional 16.8% |
| Immigrants | Lebanon | 98.4 /100 | #98 | Exceptional 16.8% |
| Jordanians | 98.2 /100 | #99 | Exceptional 16.8% |
| Immigrants | Russia | 98.2 /100 | #100 | Exceptional 16.8% |
| Immigrants | Asia | 98.1 /100 | #101 | Exceptional 16.8% |
| Irish | 98.1 /100 | #102 | Exceptional 16.8% |
| Paraguayans | 98.0 /100 | #103 | Exceptional 16.8% |
| Palestinians | 98.0 /100 | #104 | Exceptional 16.8% |
| Immigrants | Eastern Asia | 97.9 /100 | #105 | Exceptional 16.8% |
Demographics Similar to Choctaw by Cognitive Disability
In terms of cognitive disability, the demographic groups most similar to Choctaw are Hmong (18.4%, a difference of 0.030%), Chickasaw (18.5%, a difference of 0.31%), Immigrants from Eastern Africa (18.4%, a difference of 0.37%), Immigrants from Western Africa (18.4%, a difference of 0.41%), and Yaqui (18.5%, a difference of 0.42%).
| Demographics | Rating | Rank | Cognitive Disability |
| Immigrants | Kenya | 0.0 /100 | #303 | Tragic 18.3% |
| Immigrants | Eritrea | 0.0 /100 | #304 | Tragic 18.3% |
| Colville | 0.0 /100 | #305 | Tragic 18.3% |
| Seminole | 0.0 /100 | #306 | Tragic 18.3% |
| Ugandans | 0.0 /100 | #307 | Tragic 18.3% |
| Immigrants | Western Africa | 0.0 /100 | #308 | Tragic 18.4% |
| Immigrants | Eastern Africa | 0.0 /100 | #309 | Tragic 18.4% |
| Choctaw | 0.0 /100 | #310 | Tragic 18.4% |
| Hmong | 0.0 /100 | #311 | Tragic 18.4% |
| Chickasaw | 0.0 /100 | #312 | Tragic 18.5% |
| Yaqui | 0.0 /100 | #313 | Tragic 18.5% |
| Sub-Saharan Africans | 0.0 /100 | #314 | Tragic 18.5% |
| Immigrants | Dominica | 0.0 /100 | #315 | Tragic 18.6% |
| Immigrants | Middle Africa | 0.0 /100 | #316 | Tragic 18.6% |
| Liberians | 0.0 /100 | #317 | Tragic 18.6% |